Differences in Development (Grade 11 NSC Matric Geography): Revision Notes
Differences in Development
Development varies significantly across different geographical scales, from local neighborhoods to entire countries. Understanding these differences helps us analyze why some areas are more developed than others and what factors contribute to these variations.
Local differences in development
Definition: Local differences in development refer to variations that occur between and within small areas such as suburbs, neighborhoods, or schools.
These differences can be observed in your own community when you look around carefully. Consider the variations you might notice in your local area:
- Not everyone has equal access to basic services like clean water and reliable electricity
- The number of people using public transport varies greatly between different neighborhoods
- University attendance rates differ significantly from one area to another
- Employment opportunities and business ownership show marked differences across local areas
- Even access to housing and car ownership varies considerably within the same community
These local differences highlight how development is not evenly distributed, even within small geographical areas. Factors such as historical development patterns, infrastructure investment, and economic opportunities all contribute to these local variations.
Regional differences in development
Definition: Regional differences represent variations that exist between different areas of the same country.
These differences can be substantial and are often measured using various development indicators. South Africa provides an excellent example of regional development differences, with the country's nine provinces showing significant variations across multiple development indicators.
Case Study: South African Provincial Development
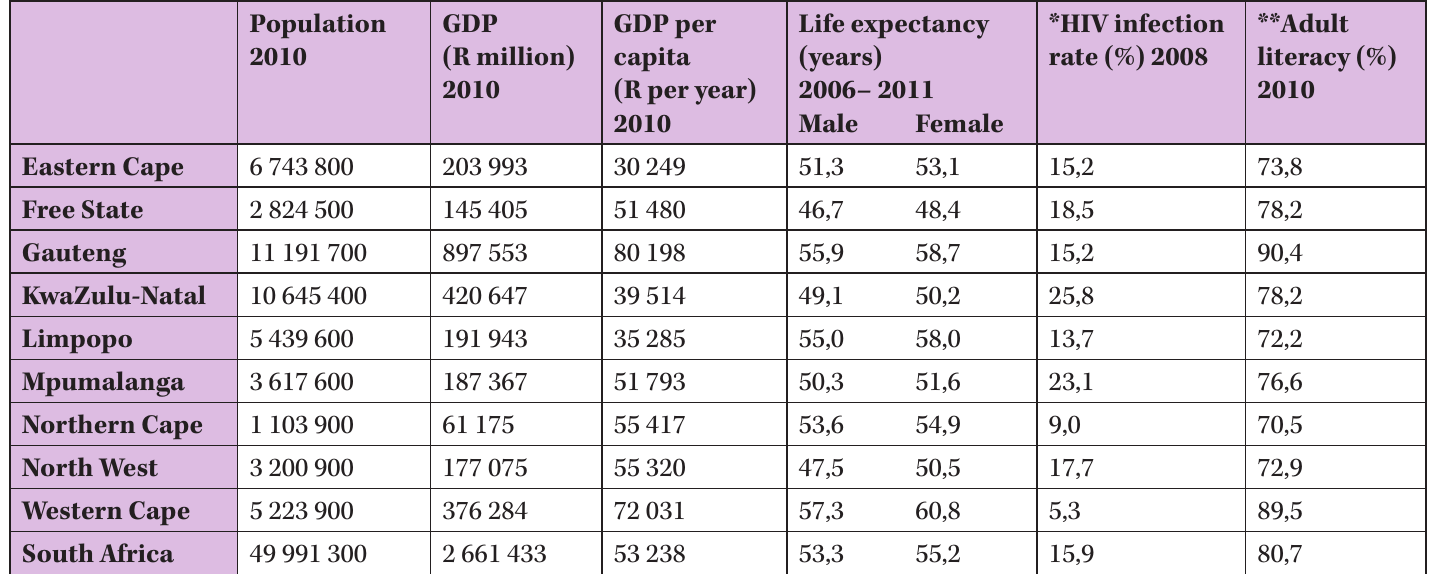
The provincial data reveals striking differences in population distribution, economic output, and social indicators:
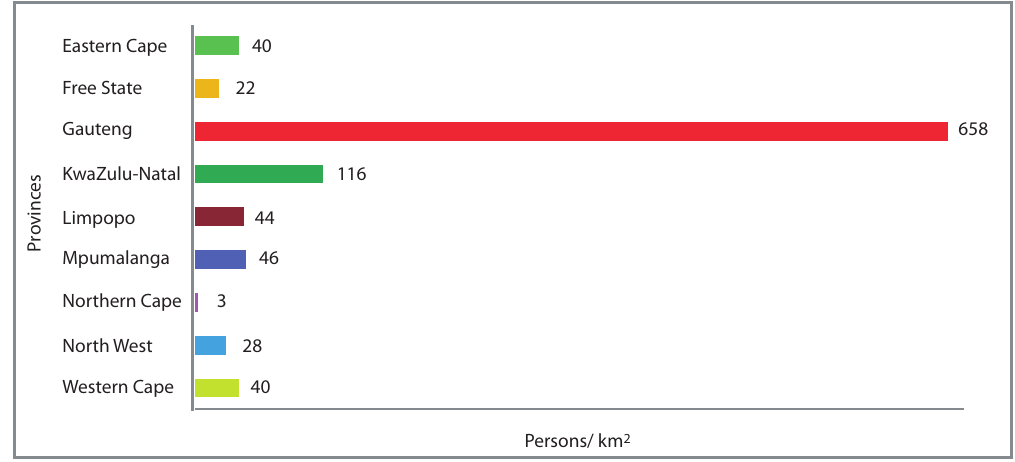
Population Density Variations:
- Gauteng: 658 people per square kilometer (highest)
- Northern Cape: 3 people per square kilometer (lowest)
This massive difference illustrates how urbanization and economic opportunities concentrate populations in certain regions.
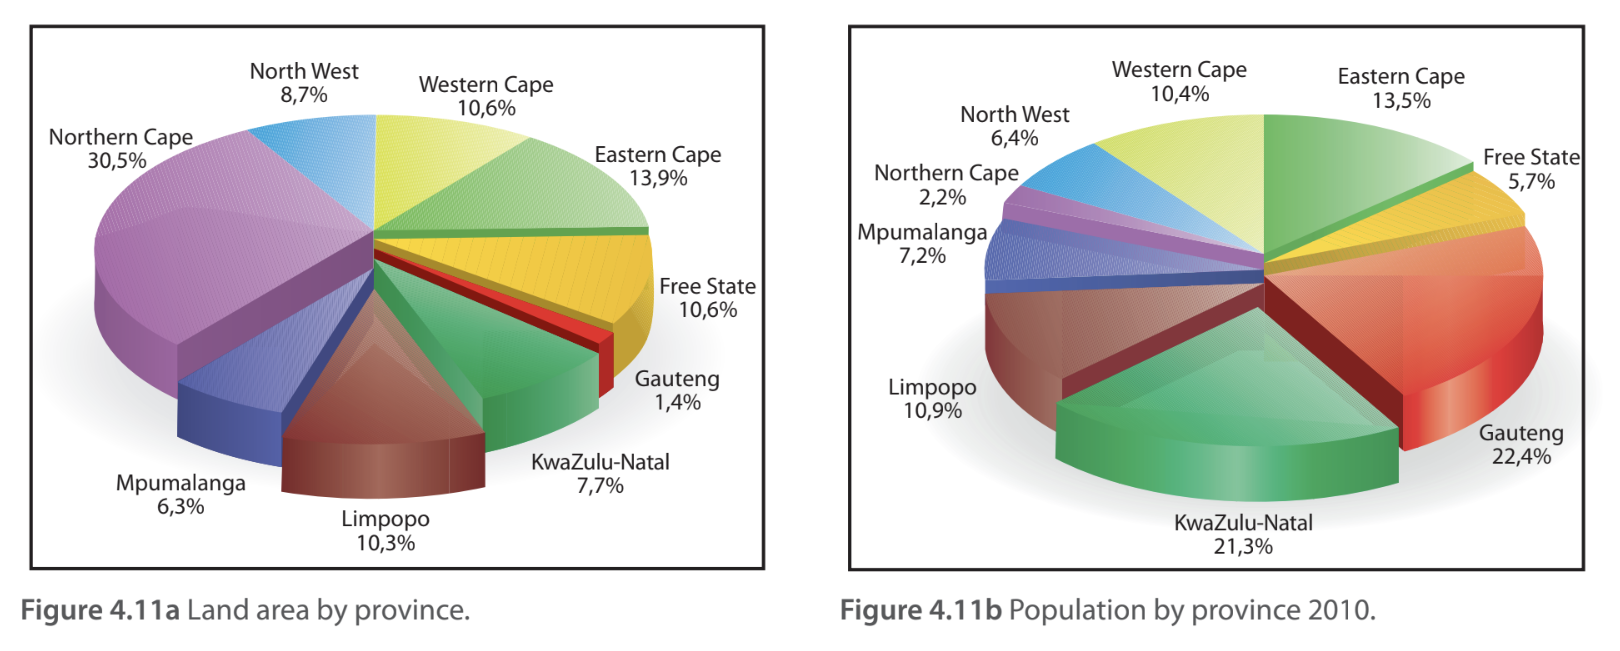
Economic Contribution vs. Land Size
Despite having a relatively small land area, Gauteng contributes over one-third of the country's GDP, while other provinces with much larger territories contribute far less to economic output.
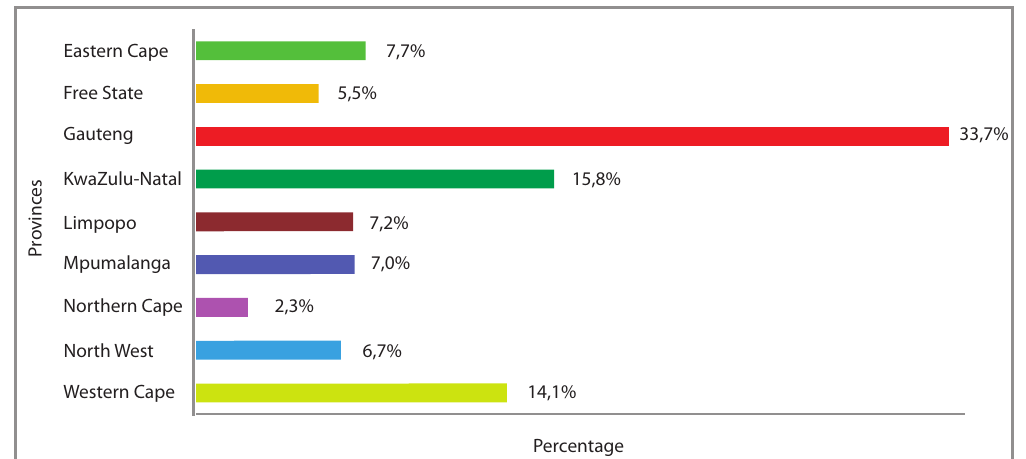
This pattern shows how economic development concentrates in certain regions, often urban areas with better infrastructure and more economic opportunities.
The regional analysis also reveals significant variations in social indicators:
- Life expectancy differs considerably between provinces
- HIV infection rates vary significantly between regions, reflecting different social and economic conditions
- Adult literacy rates show marked regional differences
- Health outcomes vary substantially across provinces
These regional differences demonstrate that development is not uniform across a country. Historical factors, natural resource distribution, infrastructure development, and government policies all contribute to these regional variations.
Global differences in development
Definition: Global differences represent variations between different parts of the world and different countries.
These differences exist because countries have different natural resources, population sizes, and development priorities.
Key Principle: Resource Utilization vs. Resource Abundance
Development depends more on how effectively a country utilizes its resources than simply on how many resources it possesses.
- Singapore has limited natural resources but is classified as highly developed
- Some oil-rich countries like Nigeria have lower development levels despite abundant natural resources
GDP vs. GDP Per Capita: The China Example
Large GDP figures do not automatically translate into wealthy citizens:
- China in 2010: World's second-largest GDP
- Population impact: Huge population meant GDP per capita was much lower
- Global ranking: Only 91st globally for GDP per capita
This demonstrates why per capita measures are essential for understanding development levels.
Different countries focus on different development priorities, creating interesting comparisons between nations with similar development levels but different approaches.
Development Priorities: Sweden vs. USA Comparison
| Indicator | Sweden | USA |
|---|---|---|
| GDP per capita | $US39 100 | $US47 200 |
| Gini coefficient | 23 | 45 |
- USA: Higher GDP per capita
- Sweden: Much lower income inequality (measured by Gini coefficient)
Sweden demonstrates that it's possible to achieve high development with more equal income distribution.
Political Stability and Development
Countries experiencing political instability or conflict often show poor development indicators regardless of their natural resource endowments:
- Military spending can consume resources that could be used for education, healthcare, and infrastructure
- Example: Chad spent 6.2% of GDP on military expenses in 2010 while allocating only 3.2% to education
These global differences highlight that development is a complex process influenced by resource management, political stability, government priorities, and historical factors rather than simply natural resource availability.
Key Points to Remember:
-
Local differences occur within small areas like neighborhoods and show that development varies even at the community level
-
Regional differences exist between areas of the same country, with provinces or states showing significant variations in economic, social, and demographic indicators
-
Global differences between countries demonstrate that effective resource utilization matters more than resource abundance for development outcomes
-
Development indicators like GDP per capita, life expectancy, literacy rates, and income inequality help measure and compare development levels across different scales
-
Population density and economic contribution often don't match - some small areas contribute disproportionately to national economic output while large areas may contribute relatively little