Inflation (Grade 11 NSC Matric Mathematical Literacy): Revision Notes
Inflation
What is inflation?
Inflation is the general increase in the price of goods and services over a period of time. When inflation occurs, the same items that you could buy for a certain amount of money in the past will cost more money in the future.
The rate of inflation is expressed as a percentage and represents the average increase in the cost of goods and services from one time period to another. For example, if the inflation rate is 5%, this means that on average, prices have increased by 5% compared to the previous period.
Understanding inflation is crucial because it directly affects your buying power. When inflation increases prices, you can buy less with the same amount of money you had before - unless your income also increases at the same rate as inflation.
Inflation is a key economic indicator that affects everyone's daily life. Even small inflation rates can have significant long-term effects on prices and your ability to purchase goods and services.
How inflation calculations work
When determining how prices will change due to inflation, we use a compound calculation that involves increasing a value by a percentage. This means we calculate the percentage of the original value and add it to get the new price.
Key Formulas for Inflation Calculations:
This can also be written as:
Worked example: car price inflation
Let's look at how car prices increase over time due to inflation.
Consider a car originally priced at R80,000 that experiences inflation of 5.5% in the first year and 8.2% in the second year.
Worked Example: Multi-Year Car Price Inflation
Year 1 calculation:
- Original price = R80,000
- Inflation rate = 5.5%
- Price increase =
- New price = R80,000 + R4,400 = R84,400
Year 2 calculation:
- Starting price = R84,400 (the new price from year 1)
- Inflation rate = 8.2%
- Price increase =
- Final price = R84,400 + R6,920.80 = R91,320.80
Notice how the second year's calculation uses the already-inflated price from year 1 as its starting point. This is what makes it a compound calculation.
Worked examples: everyday items
Here are step-by-step calculations for common items affected by inflation:
Worked Example: Everyday Item Price Increases
Example 1: Chicken price increase
- Original price: R29.50
- Inflation rate: 5%
- Calculation:
Example 2: Coca-Cola price increase
- Original price: R6.20
- Inflation rate: 7%
- Calculation:
Example 3: House price increase
- Original price: R730,000
- Inflation rate: 11.3%
- Calculation:
Example 4: Electricity tariff increase
- Original price: R0.0782 per unit
- Inflation rate: 32.8%
- Calculation:
Real-world application: food basket analysis
Food prices are commonly used to measure inflation because they represent essential household expenses. Let's examine how food prices changed over one month.
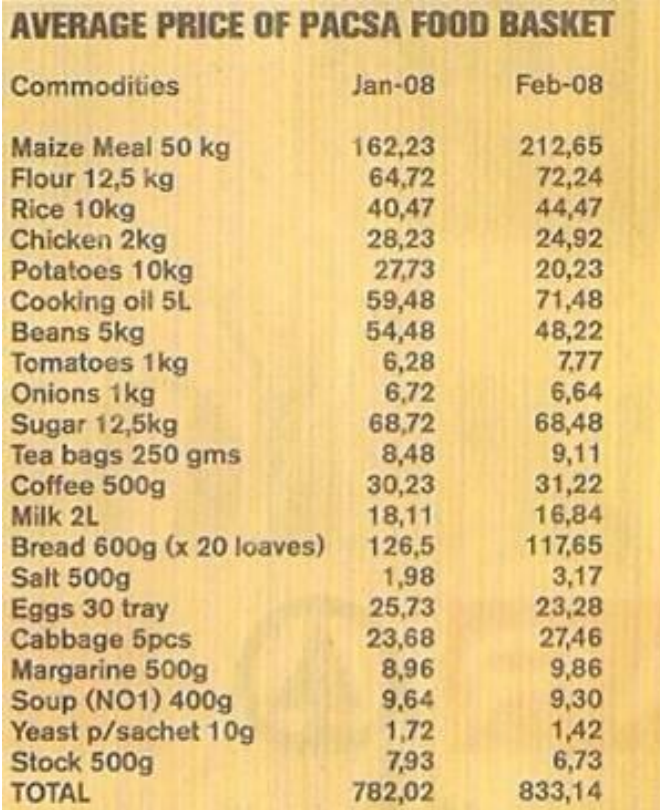
This table shows the prices of essential food items in a typical household basket comparing January 2008 to February 2008. The total cost increased from R782.02 to R833.14 in just one month.
Food baskets are used by economists and statisticians to track inflation because they represent necessary purchases that most households make regularly. This makes them a reliable indicator of how inflation affects ordinary consumers.
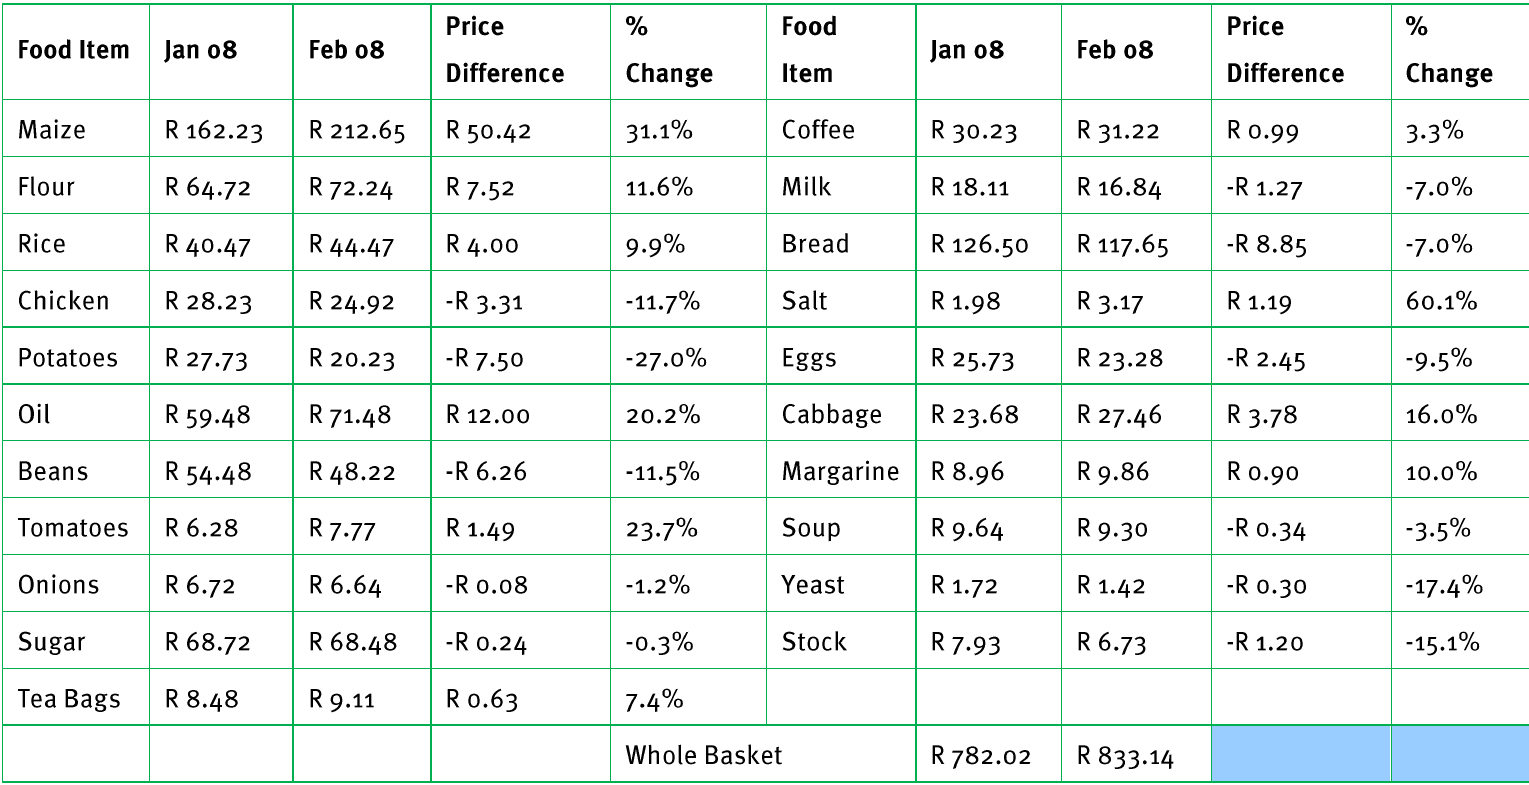
The detailed analysis reveals that:
- Some items increased significantly (maize meal by 31.1%, salt by 60.1%)
- Other items actually decreased (potatoes by 27.0%, chicken by 11.7%)
- The overall basket still increased due to the large increases in key staple foods
Calculating percentage changes
When analyzing inflation data, you need to calculate both the price difference and the percentage change.
Essential Formulas for Analysis:
Price difference calculation:
Percentage change calculation:
Worked Example: Cooking Oil Price Analysis
- January price: R59.48
- February price: R71.48
- Price difference:
- Percentage change:
Multi-year inflation trends
Inflation rates can vary significantly from year to year. Understanding these trends helps predict long-term price changes.
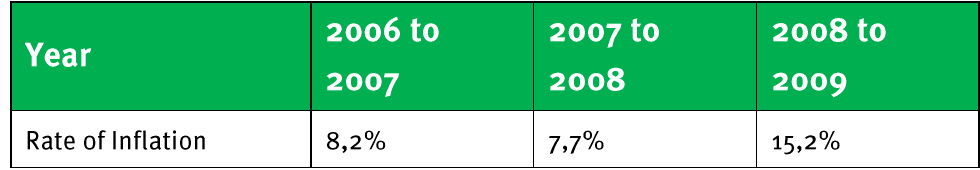
This data shows how inflation rates changed over three consecutive periods:
- 2006 to 2007: 8.2%
- 2007 to 2008: 7.7%
- 2008 to 2009: 15.2% (notably high)
Calculating cumulative inflation
For a car originally costing R99,900 in 2006, the price after three years of inflation would be:
Worked Example: Three-Year Cumulative Inflation
After 2007:
After 2008:
After 2009:
Final result: The car's price increased from R99,900 to R134,109.93 over three years.
Finding inflation rates from price data
Sometimes you need to calculate the inflation rate when given the old and new prices. Use this formula:
Inflation Rate Formula:
Worked Example: Store Price Comparison
If Checkers' food basket cost R160.00 in January and R175.00 in August:
Inflation Rate =
Exam tips
When tackling inflation problems in exams, follow these strategies:
- Always identify whether you're calculating a new price or an inflation rate
- Remember that compound calculations use the previous year's inflated price as the base
- Round your final answers to the specified number of decimal places
- Show all calculation steps clearly
- Convert percentages correctly (divide by 100 when using in calculations)
- Double-check that your answer makes sense (inflation should increase prices)
Practice problems are the best way to master inflation calculations. Work through examples systematically, and always verify that your results are reasonable given the context of the problem.
Key Points to Remember:
-
Inflation means prices increase over time, reducing your buying power with the same amount of money
-
New Price = Original Price + (Inflation Rate × Original Price) is the key formula for calculating price increases
-
Compound inflation means each year's calculation builds on the previous year's already-inflated price
-
Percentage change = (New Price - Old Price) ÷ Old Price × 100 helps you find inflation rates from price data
-
Always show your working step-by-step and round to the required decimal places in exam questions