Working Scientifically and Depth Studies (HSC SSCE Biology): Revision Notes
Planning Your Depth Study
Introduction
Planning is essential for successful depth studies in HSC Biology. Whether you're conducting primary-source investigations (collecting your own data) or secondary-source investigations (analysing existing data), careful planning ensures you collect the right information to test your hypothesis effectively.
Formulating a hypothesis
A hypothesis is a predictive statement that describes the expected relationship between variables in your investigation. It provides an 'expected' answer to your research question.
Writing a hypothesis
Hypotheses are typically written in an "If...then..." format:
"If x is introduced/increased/decreased, then y will increase/decrease/stay the same."
Example Hypothesis: Nitrogen and Plant Growth
"If the amount of nitrogen in fertiliser provided to a seedling in the soil is increased, then the height of the stem and/or length of the roots of the seedling will increase."
This hypothesis clearly identifies:
- Independent variable: Amount of nitrogen in fertiliser
- Dependent variable: Height of stem and/or length of roots
- Expected relationship: Increased nitrogen leads to increased growth
Key features of a good hypothesis
A strong hypothesis should:
- Make a testable prediction that you can measure quantitatively (using numbers and measurements)
- Be based on an existing model or theory from scientific literature
- Clearly identify the variables you will investigate
- State the expected relationship between variables
Critical Principles About Hypotheses
Hypotheses can be supported, but never proven. If your experimental results agree with your predictions, this increases confidence in your hypothesis, but doesn't prove it's absolutely true. This is why experiment aims should never start with "To prove..."
Disproving a hypothesis is valuable. If your results disagree with your hypothesis, you may have disproved it. This isn't failure! Many important scientific discoveries began when hypotheses based on existing models were disproved, leading to new questions and insights.
Hypotheses may evolve. Don't be surprised if you change or modify your hypothesis during your investigation. In scientific research, your initial question often leads to new, unexpected questions.
Comparing primary and secondary source investigations
Before planning your depth study, understand the differences between investigation types:
| Primary-Source Investigation | Secondary-Source Investigation |
|---|---|
| What data will you need to collect? | What information will you need to gather? |
| What materials and equipment will you need? | What sources will you use? |
| When and where will you collect the data? | When and where will you gather the information? |
| Who will collect the data? | Who will collect what information? |
| Who will be responsible for record keeping? | How will record keeping be done to avoid plagiarism? |
| How will the data be analysed? | How will the information be analysed? |
| How will sources be referenced? | How will sources be referenced? |
Planning your depth study
Time management
The most common problem students face is time management. You need sufficient time to:
- Perform experiments, including repeat measurements
- Analyse your data
- Report your findings
A detailed plan helps you stay on track. Your teacher may require you to submit your depth study plan before beginning the implementation stage. Creating a timeline with specific milestones can prevent last-minute rushes and ensure you allocate adequate time for each phase of your investigation.
Working in groups
Most scientists work in teams. If you can choose your group members, think carefully about:
- Working with people who have different skills from your own (not just friends)
- Assigning specific tasks to each person
- Ensuring clear communication and record keeping
Components of a depth study plan
Your depth study plan should include the following sections:
1. Title and rationale (What? Why?)
- Choose a clear, descriptive title
- Explain why you selected this research area
- Describe what you hope to achieve
- Explain potential benefits to yourself, your class, and possibly the wider community
2. Type of depth study and research model (Which?)
- State the type (e.g., literature review, practical investigation)
- Describe any theoretical models you'll use
- Include references to support your model choice
3. Timeline with working scientifically skills (When? How?)
Phase 1: Initiating and planning (e.g., weeks 1-2)
- Formulate questions and/or hypothesis
- Make predictions
- Conduct wide reading for background information
- Assess risks and ethical issues
- Plan valid, reliable, and accurate methods
- Select appropriate materials and technologies
- Identify variables and plan experimental controls
Phase 2: Implementation and recording (e.g., weeks 2-4)
- Safely carry out valid investigations
- Make observations and/or accurate measurements
- Use appropriate technology and measuring instruments
- Collect, organise, record, and process data
Phase 3: Analysing and interpreting (e.g., weeks 4-mid week 5)
- Reduce large amounts of data by summarising or coding
- Look for trends, patterns, or mathematical relationships
- Evaluate data adequacy (relevance, accuracy, validity, reliability)
Phase 4: Communicating (e.g., weeks 5-mid week 6)
- Use appropriate scientific language and terminology
- Create calculations, diagrams, and graphs
- Use other models of representation
- Acknowledge all sources
4. Data collection
a) Action: independent variable
- Describe what you will change in your investigation
b) Outcome: dependent variable
- State what you will measure
- Specify whether you'll collect quantitative or qualitative data
- Explain how you will measure it
c) Validity: controlled variables
- Identify what you'll keep constant for a fair test
- Describe control(s) you'll use (if applicable)
5. Data analysis and problem solving
d) Data analysis
- Describe methods for analysing data
- Explain how you'll represent trends and patterns
e) Conclusion
- State how you'll judge if the experiment was valid
- Explain how data will allow you to test your hypothesis or answer your question
Selecting equipment
Your hypothesis will guide equipment selection. For example, if your hypothesis predicts a temperature change of , you need a thermometer that can measure with at least this precision.
Equipment considerations
Always read the user manual to understand:
- The precision of the device
- Potential safety risks
- Correct usage procedures
Think about how to minimise uncertainties and errors. Minimising uncertainty involves both precise equipment and clever experimental technique.
Working safely: risk assessment

Before beginning your investigation, you may need to complete a risk assessment. Consider three key questions:
- What are the possible risks to you, other people, and the environment or property?
- How likely is it that there will be injury or damage?
- If there is injury or damage, how serious are the consequences likely to be?
Risk severity levels
- Negligible: Getting clothes dirty
- Marginal: A bruise from falling off a bike or from a broken branch
- Severe: Substantial injury or broken window
- Catastrophic: Death or release of toxin into the environment
Your investigation must be low risk.
All depth study investigations should fall into the negligible or marginal risk categories. If your planned investigation poses severe or catastrophic risks, you must revise your methodology or choose a different investigation topic.
Creating a risk assessment table
| What are the hazards? | What risk does this hazard pose? | How can you safely manage the risk? |
|---|---|---|
| Potassium permanganate | Eye irritant | Wear safety glasses. If solution contacts eyes, use eyewash. |
| Glassware | Broken glass may cut skin | Handle all glassware with care. If glass breaks, sweep up with brush and dustpan. |
Additional safety considerations
- Consider where you'll perform experiments or observations
- Think about the convenience and safety of others
- Talk to your teacher about available space
Ethical considerations
Biological investigations must follow ethical frameworks that protect the lives of animals and humans.
Before beginning research, consider:
- Basic human values
- Animal rights
- Rights of children
- Ethical repercussions of using certain technologies
Include information about ethical codes of conduct related to your investigation in your literature review. This demonstrates awareness of the broader implications of your research and ensures compliance with ethical standards.
For secondary-source investigations
Take precautions with:
- Cyber safety
- Keeping personal information private
Understanding variables
When conducting experiments, you must identify and control three types of variables:
1. Independent variable
The variable you are testing and therefore purposefully change. This is what you manipulate in your experiment.
2. Dependent variable
The result you measure. This changes as a result of changing the independent variable. We assume the dependent variable depends on the independent variable.
3. Controlled variables
Variables kept constant so they don't interfere with your results. These must remain the same to ensure a fair test.
Only change one variable at a time in any investigation. For depth studies, you may have two or more independent variables if time and resources allow (e.g., testing two different fertilisers), but change them separately. Changing multiple variables simultaneously makes it impossible to determine which variable caused any observed changes in your results.
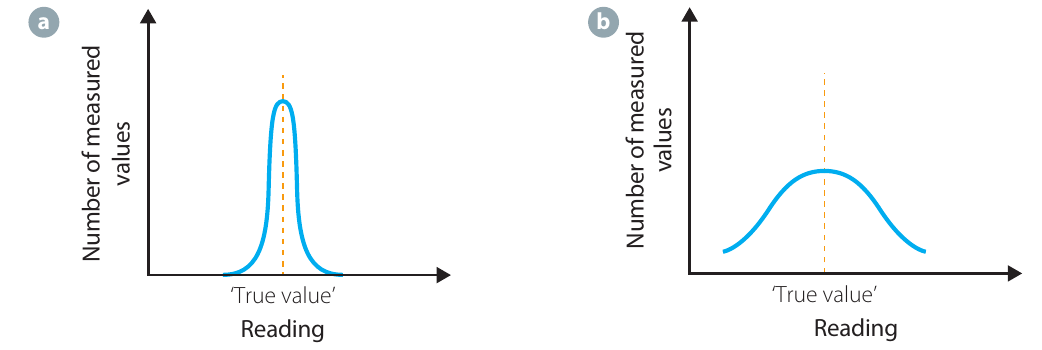
Data reliability, accuracy, and validity
Understanding these concepts is crucial for designing and evaluating investigations.
Reliability
Definition: Results are reliable if repeat measurements give the same results within experimental uncertainty.
For primary investigations:
- Make repeat measurements to check reliability
- Results are reliable if they're reproducible
- If results aren't reproducible, check for uncontrolled variables affecting the dependent variable
- Random errors in your method can cause unreliability
For secondary sources:
- Information from sources like scientific journals and texts is reliable because it's written by qualified professionals
- Check consistency across multiple reputable sources
How to assess reliability:
- Primary data: Have you tested with repetition? Have you done multiple trials and found an average?
- Secondary data: Is the information consistent with other reputable sources? Are the data based on repeatable processes?
How to improve reliability:
- Control all variables except those being tested
- Repeat experiments and average results to reduce random errors
- Use precise measuring equipment for consistent results
Accuracy
Definition: Accuracy measures how close a result is to the expected value or 'true value' given in scientific literature.
For primary investigations:
- Results agreeing with scientifically accepted values indicate accuracy
- Accuracy is linked to measurement uncertainty
For secondary sources:
- Information is accurate when similar to information in peer-reviewed scientific journals
How to assess accuracy:
- Primary data: Do results agree with the scientifically accepted value? Have you used the best measuring equipment?
- Secondary data: Is information similar to peer-reviewed scientific journals?
How to improve accuracy:
- Use the most precise measuring instruments available
- Avoid human error (e.g., measuring errors)
- Carry out repeat trials
- Find an average to smooth out random errors
- Minimise uncertainty
- Reduce systematic errors
- Use peer-reviewed secondary sources
Plausible accuracy is accuracy estimated while considering evident sources of error and instrument limitations.
Validity
Definition: For an investigation to be valid, the processes and resultant data must measure what was intended.
For primary investigations - ensure a fair test by:
- Identifying variables that need to be kept constant
- Developing strategies to ensure these variables stay constant
- Demonstrating use of a control
- Using appropriate data collection techniques
- Trialing procedures and repeating them to check results are consistent
A control removes the factor being tested to see if a negative result occurs without that factor. For example, if testing the effect of fertiliser on plant growth, your control group would be plants grown without fertiliser under otherwise identical conditions.
For secondary investigations:
- Assess whether information is relevant to the topic
- Check if sources are reliable
How to assess validity:
- Primary: Does the experiment measure the variable of interest? Does it test the hypothesis? Have all variables except those being tested been kept constant? Have errors been minimised? Are results accurate and reliable?
- Secondary: Do findings relate to the hypothesis or problem? Are findings accurate and sources reliable?
How to improve validity:
- Refine experiment design to reduce complex variables that can't be kept constant
- Reduce random and systematic errors
Accuracy versus precision
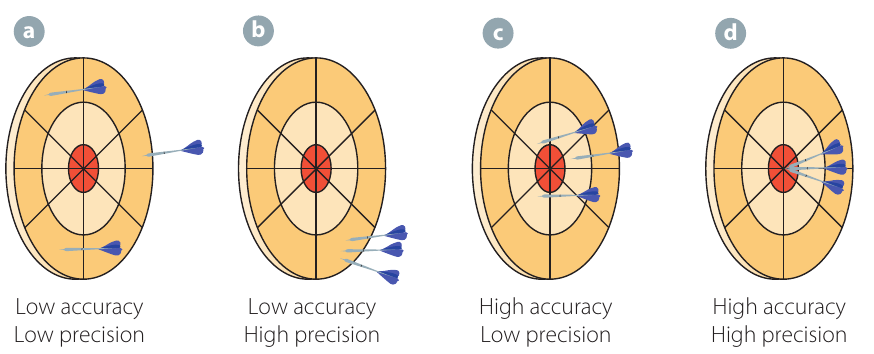
These terms are often confused, but represent different concepts.
The dartboard analogy
Think of accuracy as how close to the centre (bullseye) your dart lands, and precision as how closely you can group your darts.
- Low accuracy, low precision: Scattered darts far from centre
- Low accuracy, high precision: Clustered darts away from centre
- High accuracy, low precision: Scattered darts around centre
- High accuracy, high precision: Tightly clustered darts at centre
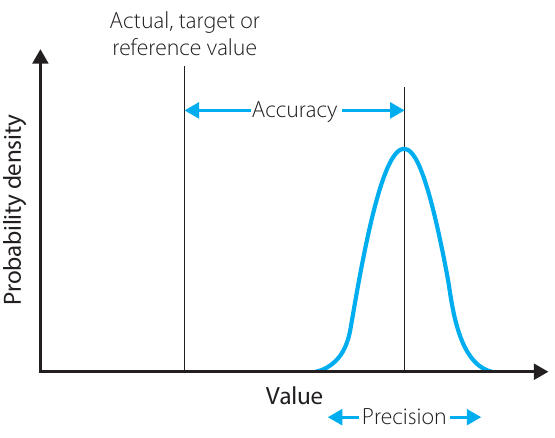
Scientific definition of precision
Precision describes the variability of measurements - it affects the spread of repeated measurements about the mean value.
- Smaller spread = greater precision
- Larger spread = less precision
For measurements to be both accurate and precise:
- They must be close to the known value (accurate)
- They must be close to each other (precise)
Errors in measurement
Systematic error
Systematic errors cause measurements to differ from the true value by a consistent amount.
Example: Parallax Error
Parallax error when reading an analogue speedometer from the passenger seat. The needle sits above the scale, and when viewed from the side doesn't line up correctly. Your readings will be consistently different from the driver's readings.
Prevention: Be aware of parallax error with any equipment using a needle. Always view measuring devices from directly above or in front to minimise this error.
Random error
Random errors cause unavoidable variations in measurements, leading to scattered data points.
Prevention: Take multiple measurements and calculate averages to reduce random error effects.
Sources of error in investigation stages
Planning stage:
- Errors from time and/or material limitations
- Assess possibilities and adjust method to minimise errors
Data collection and processing:
- Assess degree of uncertainty
- Note accuracy of measuring devices
Concluding stage:
- Evaluate investigation validity
- Discuss sources of error
- Suggest ways to reduce error in future investigations
Understanding resolution and precision
Many students confuse these terms, but they're different:
Resolution: The degree to which an instrument can be read
Precision: The degree to which an instrument can be read repeatably and reliably
Limit of reading (resolution)
The minimum uncertainty in any measurement. This differs for analogue and digital devices.
Analogue devices
Analogue devices have continuous scales (e.g., liquid-in-glass thermometers, swinging needle multimeters).
We use half because you can generally see which division mark the indicator (needle, fluid level) is closest to.
Example: Liquid-in-Glass Thermometer
A liquid-in-glass thermometer with a scale marked in degrees Celsius has a limit of reading of .
If the smallest division on the scale is , then the limit of reading is .
Digital devices
Digital devices display numbers (e.g., digital thermometers, digital multimeters).
We use a whole division because you don't know if the device rounds up or down, or at what point it rounds.
Example: Digital Thermometer
A digital thermometer reading to whole degrees has an uncertainty of .
A digital device reading to one decimal place (e.g., ) has a limit of reading of .
Digital devices aren't necessarily more precise than analogue devices. A digital device may be easier to read, but this doesn't mean it's more precise. The uncertainty from limited device precision is generally greater than the limit of reading - check the user manual for the device's actual precision.
Keeping a logbook
A logbook is a complete record of everything you do during your investigation. For working scientists, it's a legal document that may even serve as evidence in court cases (e.g., patent disputes).
Logbook requirements
Every entry must be:
- Dated
- Kept in indelible form (pen, not pencil)
- Possibly signed
Never record data on scrap paper! Always write directly in your logbook. Data recorded on loose paper can be lost, damaged, or questioned regarding authenticity.
What to include in your logbook
- Notes taken during investigation planning
- Record of when, where, and how you carried out each experiment
- Diagrams showing experimental set-ups
- Biological drawings
- All raw results
- All derived results, analysis, and graphs
- Ideas you had during planning, experimenting, and analysing
- Printouts, file names, and locations of data not recorded directly in logbook
Remember: Your logbook is a complete record, not a neat one. Make an entry every time you work on your depth study. Write down what you do as you do it - it's easy to forget details later. If you make a mistake, put a line through it and write the new data. Don't erase or scribble out.
Recording data in scientific tables
When collecting multiple data points, create a table to record them.
Rules for scientific tables
- Always draw with a ruler
- Create fully enclosed tables with appropriate headings
- Label columns with variable names and units
- Record uncertainty at the top of the column if it's the same for all measurements
- Otherwise, record uncertainty in each cell with the data
- Put units in headings, not in the table body
- Independent variable in first column (vertical table) or top row (horizontal table)
- Dependent variable in second column (vertical table) or first vertical column (horizontal table)
Analysing data as you collect it
Benefits:
- Spot outliers while still making measurements, allowing you to repeat them
- Identify interesting patterns early, giving you the choice to revise your hypothesis or continue
- Discover unexpected results that could lead to exciting new questions
Gathering data: how many data points?
General guidelines
It's better to have more data than less, but you need time for analysis and reporting.
Minimum for linear relationships: 6-10 data points to establish a straight-line relationship
For non-linear relationships: Collect more data points and space them carefully
Collect more data where the dependent variable changes quickly
Example: Cooling Experiment
When measuring temperature of a hot object as it cools over time, collect more data early when cooling is more rapid. For instance:
- Minutes 0-5: Take readings every 30 seconds
- Minutes 5-15: Take readings every minute
- Minutes 15-30: Take readings every 2-3 minutes
This approach captures the rapid initial cooling while still monitoring the slower later stages.
Analysing data
Once you've collected all data, record all analyses in your logbook.
Raw data versus derived data
Raw data: What you actually measured (with units and uncertainties)
Derived data: Data calculated using your raw data
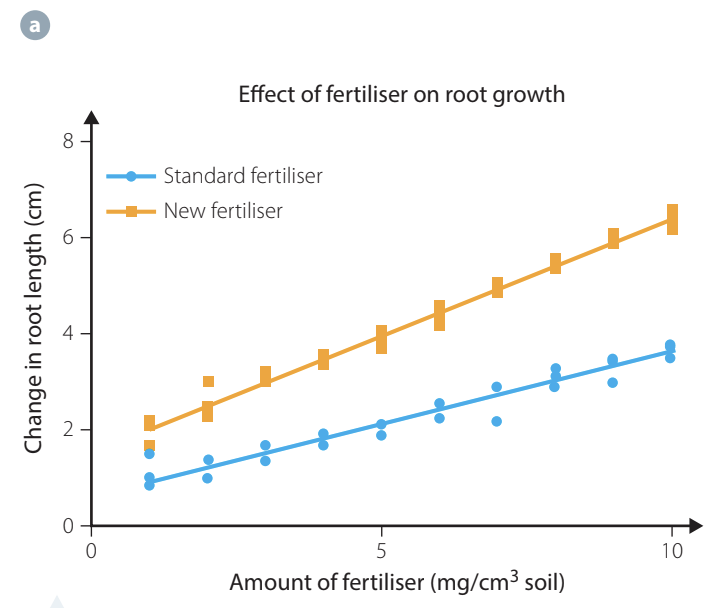
Example: Plant Growth Investigation
Raw data:
- Length of roots in each plant: 4.2 cm, 5.1 cm, 3.8 cm, 4.5 cm
- Height of shoots in each plant: 12.3 cm, 14.1 cm, 11.8 cm, 13.2 cm
Derived data:
- Average root length: 4.4 cm
- Average shoot height: 12.9 cm
- Percentage growth compared to control group
Creating graphs
Graphs are essential for representing and analysing data - almost every science journal article contains graphs.
General graphing principles
- Make graphs large and clear
- Label axes with variable names and units
- Independent variable on x-axis
- Dependent variable on y-axis
- Choose scale so data fills most of the plot area (origin may not be shown)
- Plot scale in equal increments
- Include lots of graphs in your logbook to explore data
Types of graphs
Scatter plots
Used when looking for a relationship between variables.
- Show data as points (don't join dot-to-dot!)
- Use a line of best fit if points fall in a straight line
Line graphs
Used to find relationships when both variables are continuous.
Example: Hours of light exposure (independent) versus average shoot height (dependent)
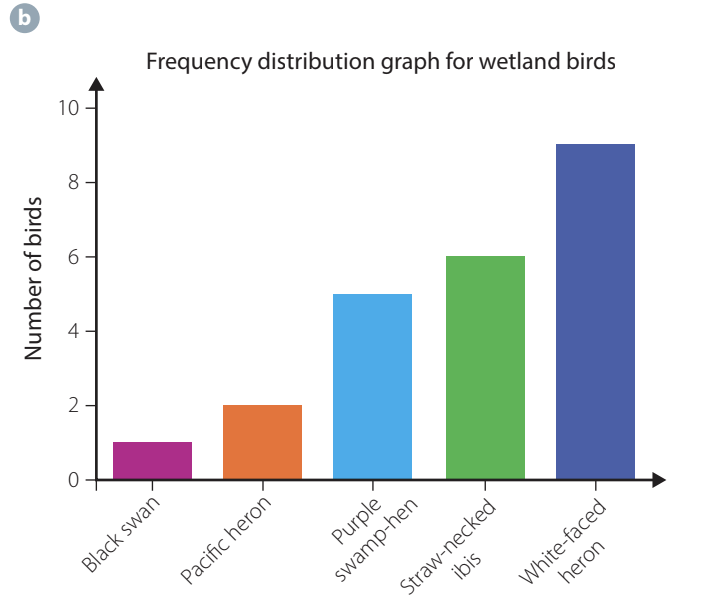
Column or bar graphs
Used when groups of things have been counted and measured.
- Column graph: Numbers on y-axis, categories on x-axis
- Bar graph: Categories on y-axis, numbers on x-axis
- Gaps between columns or bars
Example: Counting birds in an ecosystem
Histograms
Similar to column graphs, but columns touch.
Used when categories contain the same type of data.
Example: Average monthly rainfall across multiple months
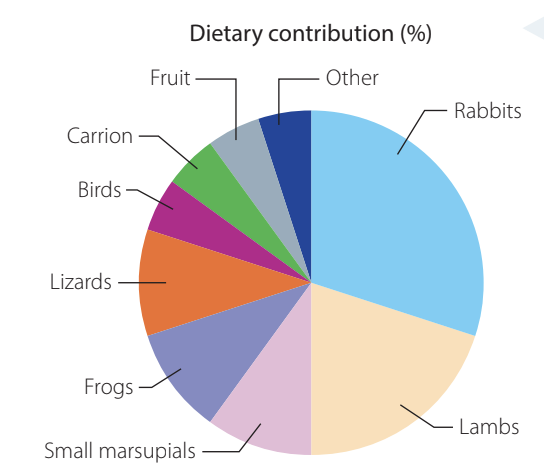
Sector (pie) graphs
Used to compare parts of a whole.
Must use a protractor when drawing.
Example: Composition of a predator's diet
Lines of best fit
Linear relationships
If your graph appears to be a straight line, fit a line of best fit - don't simply join the dots!
Minimum data points for linear fit: 6-10 points over as large a range as possible
Removing outliers
Outliers are points that don't fit the pattern of other data.
Possible causes:
- Mistakes in recording or measurement
- Something important about your system (e.g., behaviour changes at extreme values)
You may choose to remove or ignore outliers when fitting lines, but you must justify why. Consider whether the outlier represents a genuine measurement error or an interesting biological phenomenon that warrants further investigation.
Non-linear relationships
If your data forms a curve:
- Don't draw a straight line through it
- If your hypothesis predicts the curve shape, try fitting a theoretical curve
- If it fits well, your hypothesis is supported
Remember: Line of best fit ≠ joining the dots (even though spreadsheet software often defaults to this)
A line of best fit should:
- Pass through or near as many points as possible
- Have roughly equal numbers of points above and below the line
- Represent the overall trend in the data
Interpreting your results
After analysing results, you must interpret them by either:
- Answering your research question, or
- Stating whether results support your hypothesis
Considering uncertainties
Always account for uncertainties when deciding if results support your hypothesis.
Example: Enzyme Activity Investigation
Hypothesis: Maximum pepsin enzyme activity occurs between and
Result: Maximum activity observed at
Does this support the hypothesis?
- If uncertainty is : Results disagree with hypothesis (true value between and )
- If uncertainty is or more: Results agree with hypothesis (true value could be between and , overlapping with predicted range)
When your hypothesis isn't supported
Don't simply say "our hypothesis is wrong." Ask: "What is wrong with it?"
Possible explanations:
1. Model too simple
Example: Catalase Enzyme Activity
You based your hypothesis on the model that enzymes work best at body temperature ().
You find catalase works best at .
Better model: Catalase must avoid being digested in the digestive tract, so it changes shape and functions best at low temperatures (). This allows it to remain active in the stomach's acidic environment while being protected from digestive enzymes.
2. Mistakes in procedure
Before deciding the model is wrong, carefully check for experimental errors.
Never conclude "the experiment didn't work." Either:
- A mistake was made, or
- The model wasn't appropriate for the situation
Your job: Work out which, leading to more questions and deeper understanding of the biological system under investigation.
The value of unexpected results
Experiments that don't support predictions based on existing models are crucial for scientific progress. They:
- Tell us there's more to discover
- Inspire scientific curiosity
- Lead to important breakthroughs
Many significant discoveries (like penicillin) came from unexpected experimental results! Alexander Fleming didn't expect to find mould killing bacteria in his petri dishes, but his observation of this unexpected result led to one of medicine's most important discoveries.
Remember!
Key Points to Remember:
-
Planning is essential - create detailed timelines and consider all resources needed before starting your depth study
-
Understand the difference between primary and secondary investigations - they require different approaches to data collection and analysis
-
Safety first - complete risk assessments identifying hazards, likelihood, and consequences, and plan how to manage each risk
-
Know your variables - clearly identify what you'll change (independent), measure (dependent), and control (controlled variables)
-
Master the three key concepts:
- Reliability = reproducibility (do repeats give the same results?)
- Accuracy = closeness to true value
- Validity = does it measure what you intended?
-
Precision ≠ accuracy - precision is about consistency of measurements; accuracy is about closeness to the true value
-
Keep a detailed logbook - record everything as you do it, including mistakes and unexpected observations
-
Take enough measurements - minimum 6-10 data points for linear relationships, more for non-linear relationships
-
Account for uncertainties when interpreting results - they determine whether your data supports your hypothesis
-
Value unexpected results - hypotheses that are disproved can lead to the most interesting discoveries!