Modelling Geometric Growth and Decay (VCE SSCE General Mathematics): Revision Notes
Modelling Geometric Growth and Decay
What is geometric growth and decay?
Geometric growth or decay occurs when a quantity increases or decreases by the same percentage at regular intervals. This creates a pattern where values change exponentially rather than by a constant amount.
For example, a sequence that starts with and doubles each time creates the pattern This can be written as a recurrence relation: , , where each term is multiplied by the same number (the common ratio).
A recurrence relation is a formula that defines each term in a sequence based on the previous term(s). In the context of geometric growth and decay, it shows how we multiply the current value by a fixed ratio to get the next value.
Graphing geometric sequences
When we plot the terms of a geometric sequence on a graph, we can see the pattern of growth or decay visually. The graph reveals whether values are increasing exponentially (curving upward) or decreasing exponentially (curving downward and approaching zero). Let's examine two examples.
Example: Geometric growth
Consider the sequence with starting value and rule .
Converting to words:
- Starting value
- Next value current value
To find the first six terms, multiply each term by :
When plotted, these points show exponential growth, curving upward steeply as increases.
Example: Geometric decay
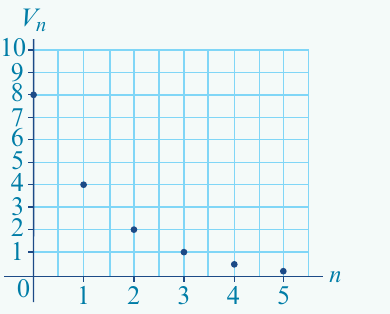
Consider the sequence with starting value and rule .
Converting to words:
- Starting value
- Next value current value
To find the first six terms, multiply each term by (halving each time):
General rules for modelling geometric growth and decay
When working with geometric sequences using recurrence relations, the common ratio is the key factor that determines whether we have growth or decay.
Understanding the Common Ratio :
For geometric growth:
- When , the recurrence relation models geometric growth
- Values increase exponentially over time
- Example: means values multiply by each period
For geometric decay:
- When , the recurrence relation models geometric decay
- Values decrease exponentially over time
- Example: means values multiply by each period (keeping of the previous value)
The value of acts as a multiplier between consecutive terms in the sequence.
Memory Aid: "R > 1 means Rising, R < 1 means Reducing"
Compound interest investments and loans
Understanding compound interest
Compound interest is more common in real-world finance than simple interest. With compound interest, any interest earned after one time period is added to the principal amount. This means the interest itself then earns interest in subsequent periods, creating geometric growth.
Consider an investment of $5000 that earns interest per annum, compounding yearly. The investment's value increases by each year.
To develop the recurrence relation:
Let be the value of the investment after years. Initially, 5000$`.
To find the rule between terms:
This gives us the recurrence relation to model the investment's growth over time.
Recurrence model for compound interest
For investments and loans that compound yearly, we use a specific formula structure that captures the growth pattern:
Let be the value of the investment after years.
Let be the annual percentage interest rate.
Compound Interest Recurrence Model:
Key point: Notice that because we keep the original amount (the "") and ADD the interest rate as a decimal.
Memory Aid: "Compound interest: ADD the rate "
Worked Example: Compound Interest Investment
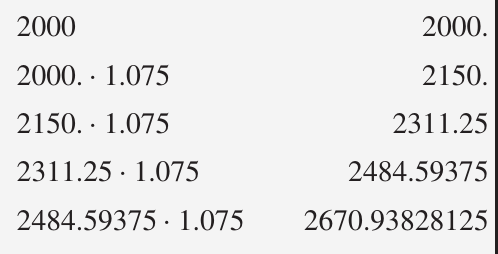
Problem: The following recurrence relation models a compound interest investment of $2000 paying interest at per annum:
where is the value of the investment after years.
Part a: Use the recurrence relation to show that the value after years is $2484.59.
Part b: Determine when the value will first exceed $2500.
Solution a:
Starting with the principal:
Calculate successive terms using the recurrence relation:
The value after years is $2484.59.
Solution b:
Continuing the calculations:
The investment first exceeds $2500 after years.
Calculator tip: You can use the repeat function on your calculator. Enter , press enter, then type and press enter repeatedly, counting how many times until the value exceeds $2500.
Reducing balance depreciation
What is reducing balance depreciation?
Reducing balance depreciation is a method where an asset's value decreases geometrically over time. Each year, the value reduces by a fixed percentage of the previous year's value. This is different from straight-line depreciation where the same dollar amount is deducted each year.
Reducing balance depreciation is more realistic for many assets (like vehicles or electronics) because they lose value more quickly in the early years and the rate of loss slows over time.
Recurrence model for reducing balance depreciation
For assets depreciating using the reducing balance method, we use a formula that models the decreasing value:
Let be the value of the asset after years.
Let be the annual percentage depreciation rate.
Reducing Balance Depreciation Recurrence Model:
Key point: Notice that because we keep a portion of the value (the "") and SUBTRACT the depreciation rate as a decimal.
Memory Aid: "Depreciation: SUBTRACT the rate "
Worked Example: Setting Up a Depreciation Model
Problem: A sofa was purchased for $7500 and is depreciating at a reducing balance rate of per annum. Write a recurrence relation where is the value of the sofa after years.
Solution:
Identify the initial value:
Calculate the value of :
The depreciation rate is per annum.
Write the recurrence relation:
Worked Example: Using the Depreciation Model
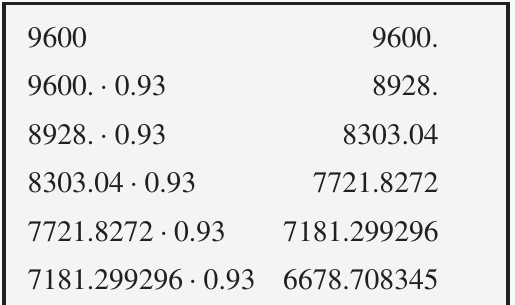
Problem: The following recurrence relation models office furniture with a purchase price of $9600, depreciating at a reducing balance rate of per annum:
where is the value of the office furniture after years.
Part a: Find the value of the furniture, correct to the nearest cent, after , , and years.
Part b: If the furniture was purchased in , at the end of which year will its value first be less than $7000?
Solution a:
Starting with the purchase price:
Calculate successive values:
Solution b:
Continue calculating until the value drops below $7000:
The value first drops below $7000 after years. Since the furniture was purchased in , it is first worth less than $7000 at the end of .
Key Points to Remember:
-
Geometric growth and decay occur when quantities change by the same percentage at regular intervals, creating exponential patterns.
-
The common ratio determines the type of change: When , we have geometric growth. When , we have geometric decay.
-
For compound interest: Use where you ADD the interest rate to . This models exponential growth of investments.
-
For reducing balance depreciation: Use where you SUBTRACT the depreciation rate from . This models exponential decay of asset values.
-
Recurrence relations provide a powerful tool for modelling real-world financial situations involving geometric growth and decay, allowing us to predict future values and answer practical questions.