Two Important Graphs (VCE SSCE Mathematical Methods): Revision Notes
Two Important Graphs
The graph of
Understanding the basic graph
The equation creates an interesting type of parabola that opens horizontally to the right, rather than vertically like the more familiar . This is because is squared rather than .
To understand this graph, let's examine some coordinate pairs. When we choose values for between and , we can calculate the corresponding -values:
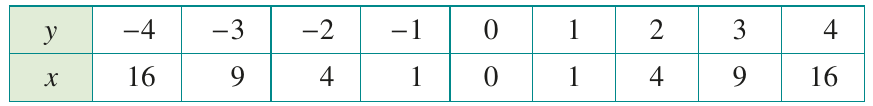
Notice that both positive and negative -values give the same -value. For example, when or , we get . This symmetry is a key feature of this graph and occurs because squaring any number (positive or negative) gives a positive result.
When we plot these points and join them with a smooth curve, we create the following parabola:
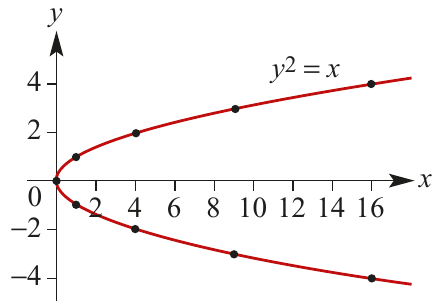
Key features of
This graph has several important characteristics:
- Shape: It forms a parabola opening to the right
- Vertex: The turning point is located at the origin
- Axis of symmetry: The -axis serves as the line of symmetry
- Relationship to : This graph is the reflection of across the line
The parabola has two branches - one extending upward into the positive region and one extending downward into the negative region. Both branches curve away from the -axis as increases.
Unlike the familiar vertical parabola , this horizontal parabola has its axis of symmetry along the -axis. This is a fundamental difference that affects how we work with transformations and find intercepts.
Transformations of
Just like other functions, we can transform the basic parabola by applying translations and dilations. The general form is:
where:
- The vertex is located at the point
- The axis of symmetry is the horizontal line
- The value of affects the width of the parabola
Worked example: Translating the parabola
Worked Example: Sketching
Let's sketch the graph of .
Solution:
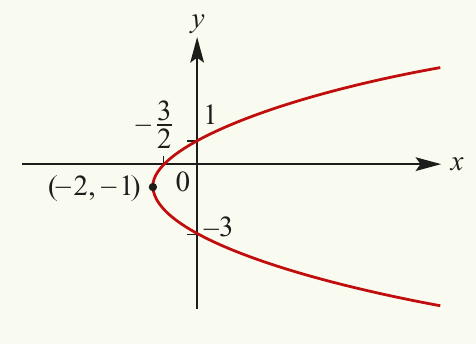
This graph is formed by taking the basic parabola and translating it units to the left and units upward.
The vertex has coordinates .
To find the -intercepts (where ):
To find the -intercept (where ):
The graph shows the parabola with vertex at , passing through the -axis at and , and crossing the -axis at .
Worked example: Completing the square
Worked Example: Rearranging
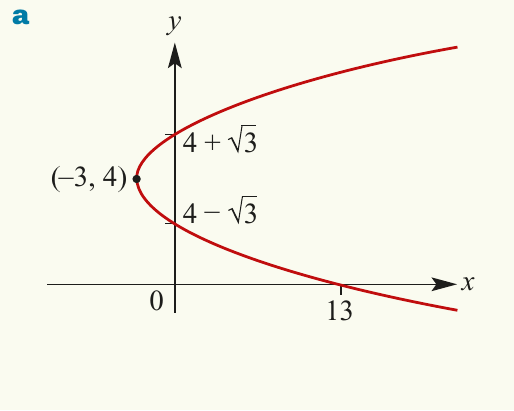
Let's sketch the graph of .
Solution:
First, we need to rearrange this equation into the standard form by completing the square:
This graph is obtained from by:
- Dilating by a factor of from the -axis
- Translating units to the left
- Translating unit downward
The vertex has coordinates .
To find the -intercepts (where ):
So or
To find the -intercept (where ):
The graph of
Understanding the basic graph
The function can also be written as . This graph represents the upper half of the parabola .
Domain Restriction: The square root function is only defined for non-negative values, so . You cannot take the square root of a negative number in the real number system.
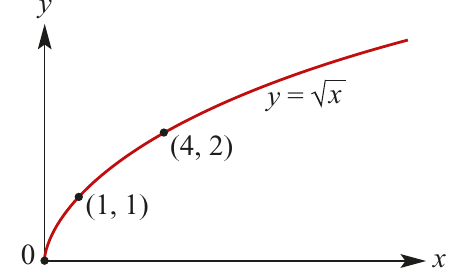
The graph starts at the origin and curves upward to the right. Some key points include and .
The general form
All graphs of the form:
have the same basic shape as , but with transformations applied:
- shifts the graph horizontally (the starting point moves to )
- shifts the graph vertically
- dilates the graph vertically and can reflect it if negative
The endpoint of the transformed graph is at .
Domain and range
Understanding Domain and Range
When working with square root functions, always consider:
- Domain: The set of -values for which the function is defined (what values can go under the square root)
- Range: The set of possible -values the function can produce
For , the domain is and the range is .
Worked example: Dilation and translation
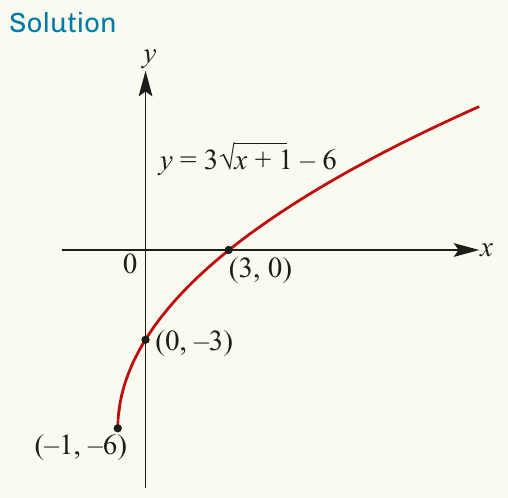
Worked Example: Sketching
Let's sketch the graph of .
Solution:
When :
When :
Explanation:
This graph is formed by:
- Dilating the graph of from the -axis by a factor of
- Translating unit to the left
- Translating units downward
The function is defined for (since we need ).
The range is all values greater than or equal to , written as .
Worked example: Reflection in the -axis
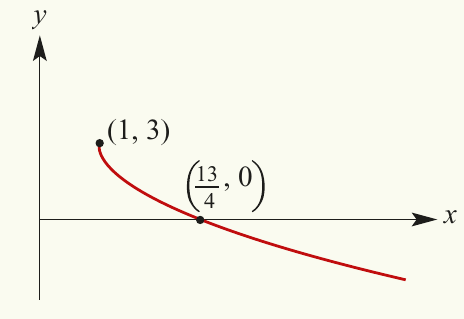
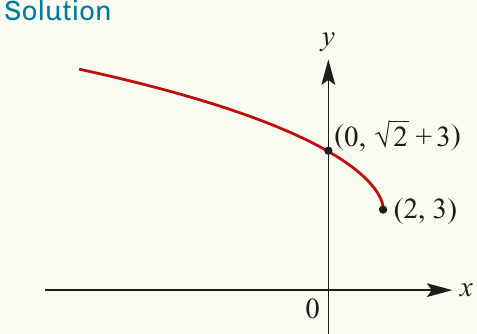
Worked Example: Sketching
Let's sketch the graph of .
Solution:
When :
Squaring both sides:
Explanation:
This graph is formed by:
- Dilating the graph of from the -axis by a factor of
- Reflecting in the -axis (due to the negative sign)
- Translating unit to the right
- Translating units upward
The function is defined for .
The range is all values less than or equal to , written as . Notice how the reflection changes the range - the graph now extends downward rather than upward.
The graph of
An important variation is the function:
This creates a graph that is the reflection of in the -axis.
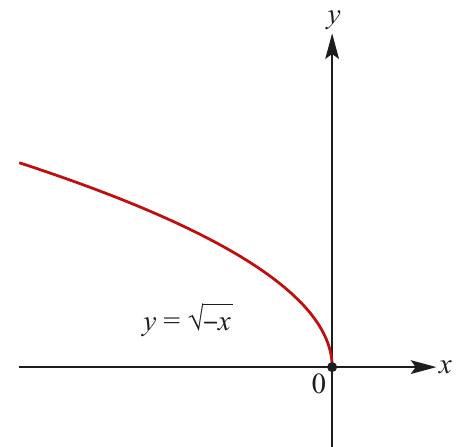
The graph extends to the left from the origin, curving upward into the second quadrant.
All graphs of the form:
follow the same basic shape as . The negative sign inside the square root causes the reflection in the -axis.
Worked example: Graph of transformed
Worked Example: Sketching
Let's sketch the graph of .
Note: We can rewrite this as
Solution:
When :
Explanation:
We can express the rule as:
This function is defined for (since we need ).
The range is all values greater than or equal to , written as .
The graph starts at the point and extends to the left, with the curve rising as decreases.
Key Points to Remember:
-
The graph of is a horizontal parabola opening to the right with vertex at the origin and axis of symmetry along the -axis
-
The general form has its vertex at and axis of symmetry at
-
The graph of is the upper half of the parabola and is defined only for
-
For square root functions, always identify the domain (valid -values) and range (possible -values)
-
The graph of is the reflection of in the -axis and is defined for