The pie charts labelled A and B show the percentages of people that work in primary, secondary and tertiary activities in a developed country and in a developing country - Junior Cycle Geography - Question Question 1 - 2008
Question Question 1
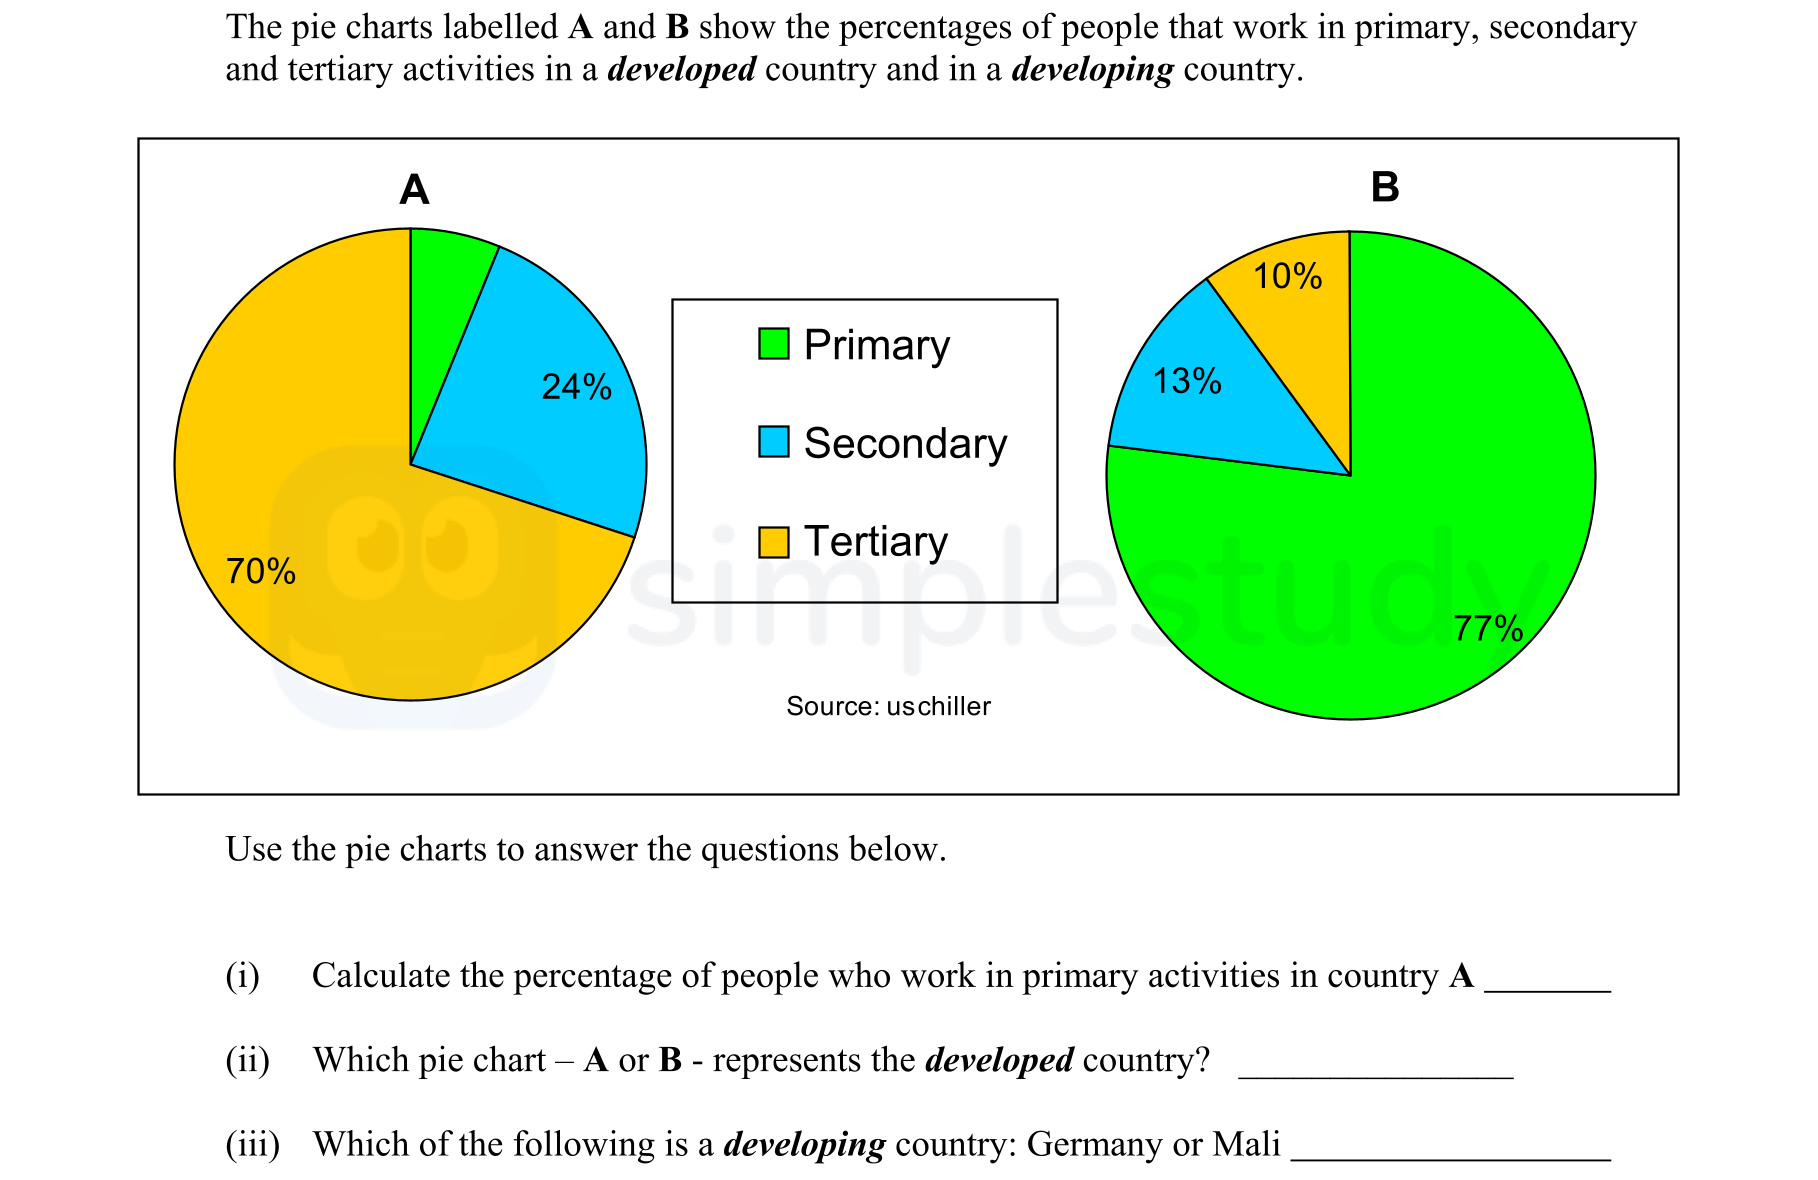
The pie charts labelled A and B show the percentages of people that work in primary, secondary and tertiary activities in a developed country and in a developing cou... show full transcript
Worked Solution & Example Answer:The pie charts labelled A and B show the percentages of people that work in primary, secondary and tertiary activities in a developed country and in a developing country - Junior Cycle Geography - Question Question 1 - 2008
Step 1
Calculate the percentage of people who work in primary activities in country A
96%
114 rated
Only available for registered users.
Sign up now to view full answer, or log in if you already have an account!
Answer
From pie chart A, the percentage of individuals working in primary activities is indicated as 70%. Therefore, the answer is 70%.
Step 2
Which pie chart – A or B – represents the developed country?
99%
104 rated
Only available for registered users.
Sign up now to view full answer, or log in if you already have an account!
Answer
Pie chart A represents the developed country.
Step 3
Which of the following is a developing country: Germany or Mali
96%
101 rated
Only available for registered users.
Sign up now to view full answer, or log in if you already have an account!
Answer
Mali is identified as the developing country.
Join the Junior Cycle students using SimpleStudy...