Quantitative Skills (AQA A-Level Geography): Revision Notes
Quantitative skills
Introduction to representing places
Places can be shown in many different ways, and each method presents a unique perspective. When studying changing places, it's essential to investigate and present your case studies using both quantitative and qualitative sources. Each type of data has strengths and limitations that you need to understand.
Understanding both quantitative and qualitative data is crucial for building a complete picture of any place. Using only one approach will give you an incomplete understanding.
Key terminology
Objective – Not influenced by personal feelings or opinions in considering and representing facts.
Qualitative data – Information that is non-numerical and used in a relatively unstructured and open-ended way. It is descriptive information, which often comes from interviews, focus groups or artistic depictions such as photographs.
Quantitative data – Data that can be quantified and verified, and is amenable to statistical manipulation.
Understanding quantitative approaches
Statistics and the census
Statistics provide us with numerical information about places. The UK census has been collecting data about the country's population for over 200 years. This large-scale survey reveals important characteristics about smaller geographical areas, including:
- Age and gender structure
- Ethnicity composition
- Levels of economic deprivation
The census offers large-scale quantitative data that helps national agencies plan for population growth and demographic changes.
The Office for National Statistics
The Office for National Statistics (ONS) is the UK's largest independent organisation producing official statistics. Its key responsibilities include:
- Collecting and publishing statistics about the economy, population and society at national, regional and local levels
- Conducting the census in England and Wales every ten years
The ONS provides accessible data that you can use to create maps and graphs about your local place.
Limitations of quantitative data
While statistics appear neutral and factual, they are not as objective as they first seem. People selectively choose which data to use for their particular purpose, making their use inherently subjective.
Critical Limitation of Statistics
Statistics reveal very little about the human experience of living in a place. Numbers cannot capture what it feels like to be part of a community or how people emotionally connect with their surroundings. Always consider what quantitative data might be missing about the lived experience of a place.
Understanding qualitative approaches
The role of maps in representing places
Maps have traditionally been used to locate places, but they do far more than this. Maps can significantly influence how we think and feel about places, playing a crucial role in shaping both our sense of place and perception of place.
It's important to examine maps critically because throughout history they have distorted reality. Early world maps, such as the Mappamundi (created around 1300), depicted the world as a flat disk with Jerusalem at its centre. These religious maps reflected the worldview of their time rather than geographical accuracy.
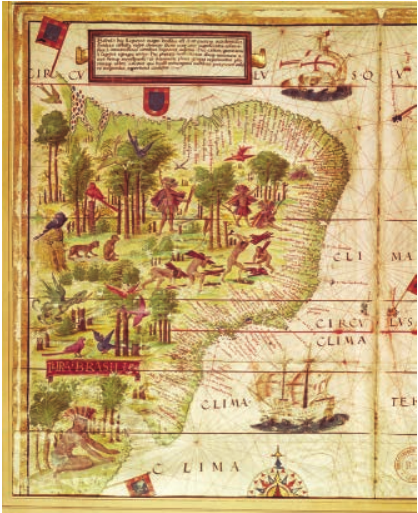
During the colonial expansion period, maps exaggerated area size and resources to emphasise strategic importance. Early cartographers actively promoted the cause of empire through their map designs. This historical example shows how maps can contain hidden bias and influence.
Analysing the Mercator projection
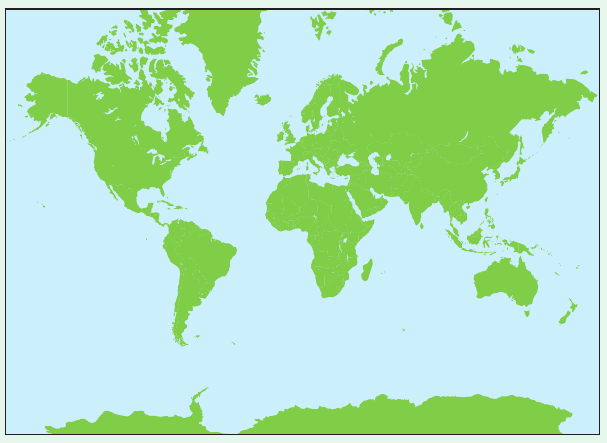
The Mercator map projection was first used in the sixteenth century as a navigational tool for sailors. However, this projection has become standard in geography classrooms despite serious flaws.
Three Major Problems with the Mercator Projection
-
It distorts relative size of land masses – For example, Greenland appears the same size as Africa, but in reality Africa is 14 times larger.
-
It creates a northern hemisphere bias – The northern hemisphere appears at the top, though the world doesn't have a label saying 'this way up'.
-
It is Eurocentric – The map not only exaggerates Europe's size but positions it in the middle of the map, suggesting centrality and importance.
Educationalists have criticised its use in classrooms for decades because it fails to accurately depict the Earth's northern and southern latitudes. Yet many people unthinkingly accept it as an accurate representation of the world.
Counter-mapping
Counter-mapping describes a grassroots approach where people create their own maps based on local knowledge and understanding of places. Rather than accepting official or corporate representations, communities can produce alternative maps that reflect their own experiences and priorities. This bottom-up process empowers local people to represent their place in meaningful ways.
Geographical Information Systems
The expansion of Geographical Information Systems (GIS) means that increasingly diverse geographical data is available for research and analysis. The Consumer Data Research Centre, established by the UK Economic and Social Research Council, provides comprehensive geographical data that has been mapped and is accessible for study.
Remember!
Key Points to Remember:
-
Quantitative data provides numerical information about places but can be selectively used, making it less objective than it appears.
-
Qualitative data such as maps can powerfully influence how we perceive places, but may contain hidden biases.
-
The Mercator projection distorts land mass sizes and creates a Eurocentric worldview that favours the northern hemisphere.
-
Counter-mapping allows communities to create their own representations based on local knowledge and experience.
-
Both quantitative and qualitative sources have strengths and limitations – use multiple sources to build a balanced understanding of places.