Population Parameters (AQA A-Level Geography): Revision Notes
Population Parameters
Understanding how populations are distributed across the world and what factors influence where people live is fundamental to human geography. This note explores the key parameters used to measure and describe population patterns.
Understanding population distribution and density
The physical environment plays a crucial role in determining where people choose to live and how densely they settle. Two important concepts help us understand these patterns:
Population density – The average number of people living in a specified area, usually expressed as the number of people per km².
Population distribution – The pattern of where people live. This can be considered at all scales from local to global, in an area or country.
Egypt case study: The power of water supply
Egypt provides an excellent example of uneven population distribution influenced by physical geography:
Case Study: Egypt's Population Concentration
- Egypt's total population: 102 million people
- Population distribution: 95% live on just 4% of the country's land area
- Location: Within 12 miles of the River Nile
- Nile Valley density: 2,000+ people/km²
- National average density: 103 people/km²
- Desert areas: Fewer than 10 people/km²
This dramatic variation demonstrates how access to water resources fundamentally shapes where populations can establish themselves.
Global patterns of population density
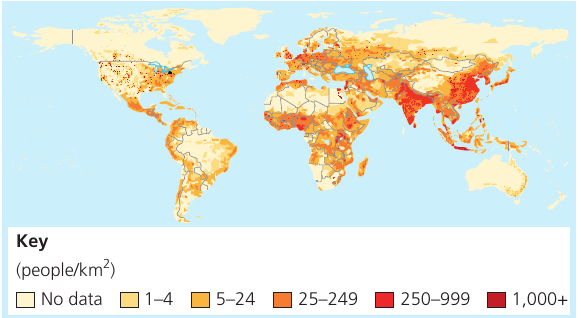
The world map above shows striking variations in population density across different regions. The densest concentrations appear in:
- The Ganges Valley in India
- Eastern China
- South East Asia
- Parts of northern Europe
In contrast, areas of population sparsity correlate with:
- Desert regions (e.g. Sahara)
- Continental interiors with limited resources
- Extreme cold temperature zones (e.g. Siberia, Canadian Shield)
Urban areas consistently show higher population densities than surrounding rural regions, reflecting the concentration of economic opportunities and services in cities. This pattern is consistent across all continents and development levels.
How population numbers are measured
Census data forms the foundation of population measurement. Most countries conduct a census every five or ten years to count their population.
However, population is constantly changing, so between census periods, estimates are calculated using:
- Birth rates – Number of births per year
- Death rates – Number of deaths per year
- Net migration – The balance between people moving in and out
Population change
When we talk about population change, we consider both:
- Temporal perspective – How population grows or declines over time (measured by rates of growth or decline)
- Spatial perspective – How population distribution shifts across different areas
This dynamic nature of population means that understanding both numbers and their geographic patterns is essential.
Physical factors influencing population distribution
Water supply
Access to water is fundamental for human survival and settlement. Water serves multiple purposes beyond basic hydration:
- Irrigation – Essential for food production
- Hygiene and sanitation – Public health requirements
- Industrial processes – Manufacturing and production
- Drinking water – Basic human need
The importance of water in population distribution is evident along major river valleys worldwide, where dense populations cluster near reliable water sources. This pattern has remained consistent throughout human history, from ancient civilizations along the Nile, Tigris, and Indus rivers to modern urban centers today.
Geology and resource distributions
The presence of valuable resources has historically driven population concentration:
Fossil fuels and minerals have created densely populated industrial regions:
- The Ruhr Valley in Europe (coal and steel)
- Parts of the USA (various mineral resources)
- China and India (increasing industrial development)
Legacy effects: Even after resources become depleted, large populations often remain as new tertiary (service) industries develop to support the existing community. This demonstrates how initial resource-based settlement can create self-sustaining population centers.
Soil quality also matters:
- Rich volcanic and alluvial soils attract agricultural populations
- Poor quality soils may support smaller populations
- However, fertile soils in hazard-prone areas (volcanic regions, flood plains) create complex risk-benefit situations for settlement
Key Points to Remember:
- Population density measures the average number of people per km², while population distribution describes the pattern of where people actually live across different scales
- Physical environment factors, particularly water supply, are the primary determinants of population distribution patterns
- Egypt demonstrates extreme population concentration, with 95% of people living on just 4% of the land near the Nile River
- Population numbers are measured through census data (every 5-10 years) and estimated between censuses using birth rates, death rates, and net migration
- Urban areas consistently show higher population densities than rural areas due to concentration of economic opportunities and services