The Normal Distribution (AQA A-Level Mathematics): Revision Notes
4.3.1 The Normal Distribution
The normal distribution is a fundamental concept in statistics. It describes how data is distributed around the mean (average) in a symmetrical, bell-shaped curve. Here's a breakdown of the key aspects:
Characteristics of the Normal Distribution
- Symmetry: The curve is perfectly symmetrical around the mean.
- Mean, Median, Mode: All three measures of central tendency are the same and located at the centre of the distribution.
- Bell-shaped curve: The tails of the curve approach, but never touch, the horizontal axis.
- -- Rule:
- % of the data lies within standard deviation of the mean.
- % of the data lies within standard deviations.
- % of the data lies within standard deviations.
Standard Normal Distribution (Z-distribution)
- A special case of the normal distribution where the mean and the standard deviation .
- Any normal distribution can be converted to the standard normal distribution using the formula:
- Z-scores: These represent how many standard deviations a data point is from the mean.
The Importance of Normal Distribution
The normal distribution is essential for understanding many statistical concepts and is widely used in real-world data analysis.
This distribution fits the behaviour of how things distribute themselves in nature.
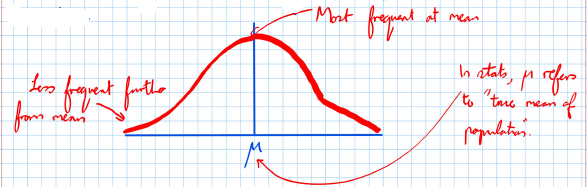
- Most frequent at mean: The peak of the curve represents the mean , which is the most frequent value.
- Less frequent further from mean: The tails represent values that occur less frequently.
- In stats, refers to the "true mean of population." In this distribution, the area between the graph and the -axis represents probability. The main purpose of the normal distribution is to model the distribution of continuous quantities that occur in nature (heights, weights, reaction times, etc.).
Using the Normal Distribution in Exams
- Finding probabilities: You may be asked to find the probability that a variable falls within a certain range. This involves calculating the area under the curve, often using -scores and statistical tables or a calculator.
- Inverse problems: You may need to find a value given a probability, which involves using the inverse of the standard normal distribution.
Worked Example
Example: Suppose is normally distributed with a mean of and a standard deviation of . What is the probability that is less than ?
Step 1: Convert to a -score:
Step 2: Look up the -score in the standard normal distribution table (or use a calculator) to find the probability.
The area to the left of is approximately .
The probability that is .
Notation
denotes a variable which has a normal distribution with mean and variance .
For example:
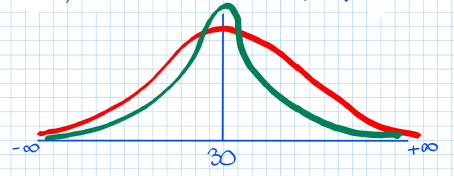
- would look like the curve in red.
- would look like the curve in green.
Lower variance less spread, more bunched up around .