Aggregate Supply (Edexcel A-Level Economics A): Revision Notes
Aggregate Supply
Introduction to aggregate supply
Aggregate supply represents the total output of goods and services produced within an economy during a specific time period. It differs significantly from individual market supply curves that you may have studied in microeconomics. At the macroeconomic level, we examine the relationship between the overall price level and the total quantity of output supplied across the entire economy.
At the macroeconomic level, we're not looking at individual products or markets, but rather the total production across the entire economy. This is fundamentally different from the supply curves you've encountered in microeconomics, which focus on specific goods or services.
Understanding aggregate supply requires distinguishing between the short run and the long run. The ability of firms to adjust their output depends heavily on the time period under consideration and the flexibility they have in changing their production inputs.
The short-run aggregate supply curve
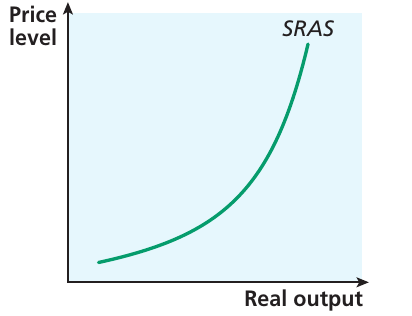
In the short run, firms face constraints when attempting to vary their production inputs. Many costs, particularly wages, tend to be fixed. When firms want to increase output quickly, they often must do so by increasing the intensity with which they use existing inputs. For example, a business might pay existing workers overtime or pay premium prices for rapid delivery of raw materials. Firms may be willing to accept these higher costs if they can pass them on through increased prices.
The short-run aggregate supply (SRAS) curve shows the relationship between the overall price level and the amount of output firms are prepared to supply in the short run. This curve is upward sloping, indicating that as the price level rises, firms are willing to supply more output.
Understanding Movements vs Shifts
An important distinction exists between movements along the SRAS curve and shifts of the curve itself:
- When the overall price level changes, this causes a movement along the existing curve
- When production costs change, this shifts the entire SRAS curve to a new position
Factors shifting the short-run aggregate supply curve
Several factors can cause the SRAS curve to shift, affecting the amount of output firms are willing to supply at any given price level.
Cost of inputs
Changes in the prices of raw materials directly impact production costs. If a key raw material becomes scarce and its price increases, production costs rise. Firms may then choose to supply less output at any given price level, causing the SRAS curve to shift leftward.
Oil prices deserve particular attention as they affect the economy in multiple ways. Oil is a crucial input for many businesses, influencing:
- Energy costs across all sectors
- Transport expenses for goods and services
- Agricultural production (oil is a key component in fertiliser production)
Significant variations in oil prices can therefore have a substantial impact on the position of aggregate supply.

Labour costs
Labour represents another key input for firms. An increase in wages raises production costs, which leads to a leftward shift of the SRAS curve. Conversely, if labour costs fall, the curve shifts rightward as firms can profitably supply more output at each price level.
Exchange rate
For firms that rely on imported raw materials, energy, or component parts, changes in the exchange rate affect production costs. If the exchange rate appreciates (strengthens), the domestic price of imports falls, potentially reducing costs and shifting SRAS rightward. If the exchange rate depreciates (weakens), import costs rise, and SRAS shifts leftward.
Firms can protect themselves against exchange rate fluctuations through contracts with suppliers that specify future prices in ways that hedge against exchange rate changes. This strategy helps businesses manage cost uncertainty from currency movements.
Government intervention
Government policies can affect firms' costs. Increased regulation requiring greater spending on health and safety measures raises costs, causing a leftward shift of the SRAS curve. Similarly, an increase in corporation tax has comparable effects by reducing the profitability of production at any given price level.
The long-run aggregate supply curve
Economists hold different views about how aggregate supply behaves in the long run. These differences have significant implications for economic policy.
Classical/monetarist view
The classical/monetarist school believed that the macroeconomy always adjusts rapidly toward full employment. They argued that the economy would consistently converge on an equilibrium at the natural rate of output, which represents the long-run equilibrium level of output. Associated with this equilibrium is the natural rate of unemployment.
According to this view, the long-run relationship between aggregate supply and the price level is vertical. This means that changes in the overall price level do not affect aggregate output in the long run because the economy rapidly readjusts back to full employment.
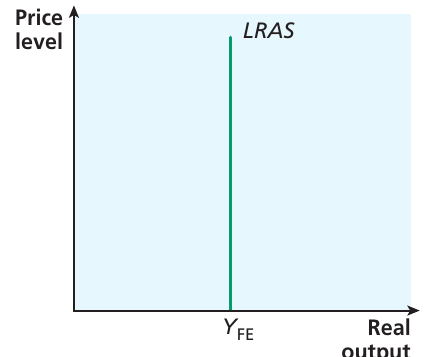
Key Insight: The Vertical LRAS
In the classical/monetarist view, the LRAS curve is perfectly vertical at (full employment output). This has a crucial implication: policies affecting aggregate demand only impact prices, leaving real output unaffected in the long run.
This means that attempts to stimulate the economy through demand-side policies will ultimately only lead to inflation, not increased real output.
Keynesian view
The Keynesian school held that the macroeconomy was not sufficiently flexible to enable continuous full employment. They argued that the economy could reach equilibrium at a position below full employment, at least in the short to medium term. Inflexibilities in labour markets, particularly if firms held pessimistic expectations about aggregate demand, could prevent adjustment to full employment.
According to Keynesian economists, if firms expected weak demand and reduced their output, this would lead to lower incomes for workers who faced redundancy. This pessimistic outlook could become self-fulfilling, with aggregate demand remaining genuinely deficient.
The Keynesian Perspective on Long-Run Supply
These arguments led to the belief that long-run aggregate supply could be horizontal over a range of output levels, becoming steeper as the economy approached full employment.
The Keynesian LRAS curve shows that:
- Real output can increase over a range without putting upward pressure on the price level
- As the economy nears full employment (), the curve becomes steeper
- The economy can become "trapped" below full employment, requiring policy intervention
The shape of the LRAS curve has significant implications for economic policy. A vertical LRAS suggests limited scope for using demand-side policies to affect the economy's path, especially if adjustment to long-run equilibrium occurs rapidly. Conversely, Keynesian economists argued that the economy could become trapped below full employment, requiring policy intervention to restore full capacity utilisation.
Factors affecting the long-run aggregate supply curve
Regardless of whether the LRAS curve is vertical or upward sloping, it is important to understand what factors determine its position. Both classical/monetarist and Keynesian approaches recognise a capacity level of aggregate output, so we need to identify what determines this capacity.
Quantity of inputs
The most direct way to increase potential aggregate output is through an increase in the availability of factors of production. Specifically, increases in labour and capital inputs enable greater production.
Labour supply: The size of the workforce influences aggregate supply position. While workforce size changes relatively slowly, it affects long-run rather than short-run aggregate supply. Migration represents one mechanism through which the workforce expands. For example, the expansion of EU membership in May 2004 led to significant migration into the UK, expanding the workforce and increasing potential output.
Demographic Changes and Labour Supply
Demographic changes also affect workforce size in the long run. The UK and many advanced economies have experienced population ageing in recent years. As more people reach retirement age, the working population falls as a proportion of the total population, potentially shifting LRAS leftward.
Policy responses have included changes to retirement age; until 2011, the default retirement age in the UK was 65 years, but this was abolished to allow those wishing to continue working beyond 65 to do so.
Capital: An increase in the quantity of capital also enhances the economy's productive capacity. However, such increases require firms to undertake investment activity. The balance between consumption and investment spending affects the position of the aggregate supply curve in future periods.
Effective use of inputs
Beyond the quantity of inputs, the effectiveness with which they are utilised significantly influences the aggregate supply curve's position. Technological advances provide one route through which inputs can be used more effectively. New machinery can improve efficiency in using other inputs, and the development of new materials can have similar impacts. Such developments reduce firms' costs and increase the amount of aggregate output that can be produced, shifting the long-run aggregate supply curve rightward.
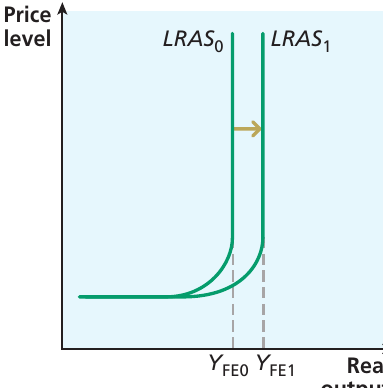
The diagram above illustrates a rightward shift in LRAS, from to , with corresponding increases in full employment output from to . This shift could result from technological improvements, increases in input quantities, or enhanced input effectiveness.
Human Capital and Productivity
Labour can also become more effective and productive through human capital improvements. Education and skills training enhance labour productivity, leading to a rightward shift of long-run aggregate supply.
Training and education may be especially important for economies undergoing structural change, as workers need preparation to move between occupations. Government encouragement or provision of such training can improve labour market flexibility and positively affect aggregate supply.
Transport infrastructure also plays a role. Increased congestion on roads raises transport costs and leads to less efficient input use, raising costs for firms. These effects cause a leftward shift of the aggregate supply curve. Conversely, improvements to infrastructure in the domestic economy, such as transport system enhancements, have the opposite effect by reducing firms' costs and enabling a rightward shift of the aggregate supply curve.
Real-world application: the COVID-19 pandemic
Worked Example: COVID-19 Impact on Aggregate Supply and Demand
The COVID-19 pandemic that swept across the world in 2020 affected people in almost every country. Healthcare systems faced enormous and unanticipated pressure. Many people were unable to work, and in many countries there were strong restrictions on movement, with many people confined to their homes. International travel was restricted, with many airlines facing financial difficulties.

Impact on Aggregate Demand: The pandemic brought sudden changes to the demand side of the macroeconomy:
- Consumption fell as illness spread and many individuals were unable to work
- Firms were discouraged from undertaking new investment
- Overall spending in the economy declined significantly
Impact on Aggregate Supply: The supply side was also severely disrupted:
- Supply chain disruption as firms faced loss of workers or had to enable remote working
- Some firms producing non-essential products were forced to cease production
- There was a forced reduction in the potential full capacity of the economy
Policy Response: Many governments launched massive spending programmes to offset the impact:
- Building capacity in healthcare systems
- Searching for treatments and vaccines
- Protecting small and medium-sized enterprises by providing support for employees who had been prevented from working
- These measures aimed to make it easier for firms and their employees to restart when the pandemic receded
Key Points to Remember:
Short-run aggregate supply:
- The SRAS curve shows the relationship between aggregate supply and the overall price level
- A change in the overall price level induces a movement along the short-run aggregate supply curve
- Changes in the costs faced by firms result in a shift of the short-run aggregate supply curve
Long-run aggregate supply:
- It is useful to distinguish between classical/monetarist and Keynesian views about the shape of the long-run aggregate supply curve
- Monetarist economists have argued that the economy always converges rapidly on equilibrium at the natural rate of output, implying that policies affecting aggregate demand have an impact only on prices, leaving real output unaffected. The aggregate supply curve in this world is vertical
- The Keynesian view is that the economy may settle at an equilibrium that is below full employment, and that there is a range over which the aggregate supply curve is flat or slopes upwards
- The position of the long-run aggregate supply curve depends on the quantity of inputs available and on the efficiency with which they are utilised
Remember!
- SRAS is upward sloping: In the short run, higher price levels encourage firms to supply more output, but at increasing cost
- Two schools of thought on LRAS: Classical/monetarist economists see LRAS as vertical at full employment, while Keynesian economists see it as horizontal then upward sloping
- Cost changes shift SRAS: Factors like input costs, oil prices, exchange rates, and government intervention shift the SRAS curve left or right
- Long-run capacity depends on inputs: The position of LRAS depends on the quantity of labour and capital available, plus how effectively these inputs are used
- Technology and education matter: Improvements in technology, education, and training shift LRAS rightward by increasing productivity and potential output