Discrete Random Variables (Edexcel A-Level Further Mathematics): Revision Notes
16.1.1 Discrete Random Variables
Discrete Random Variables
A discrete value is one that can only take a certain number of fixed values (i.e., they can be counted).
A variable is random if its value depends on chance. Something can be described as random even if there is not an equal chance for each outcome.
Example: An unfair dice, which is biassed, is still random.
Probability Distribution
A probability distribution is a list or a formula that describes all possible outcomes of a random variable X and the associated probabilities.
Example: The following table is the probability distribution for an unfair dice.
| x | 1 | 2 | 3 | 4 | 5 | 6 |
|---|---|---|---|---|---|---|
- Large X for the actual outcome!
- Small x for possible outcomes.
Worked Example
Example: A biassed dice has a probability of of obtaining a 6. All other outcomes are equally likely.
State the probability distribution of , where represents the number rolled.
| x | 1 | 2 | 3 | 4 | 5 | 6 |
|---|---|---|---|---|---|---|
Calculations:
Expectation and Variance of a D.R.V. (Discrete Random Variable)
Expectation in this context means "mean score per turn."
Take, for example, the previous distribution:
| x | 1 | 2 | 3 | 4 | 5 | 6 |
|---|---|---|---|---|---|---|
- E(X) means "expectation" or "mean per throw" of X.
- E(X) = In this example:
- means the expectation or mean of all the values.
- In this example:
The variance :
Thus, in this case:
This measures what we expect the variance of a set of data taken from a large number of throws to be.
Estimating Population Parameters of a Distribution
When calculating the mean and standard deviation of a set of data, in the past we have had the entire population of data for which we are calculating these statistics. In such a case, we have:
(when we have the entire population of data)
However, we may want to estimate the mean and variance of a population using a limited sample of data. In this case, the formula for the mean stays the same, but the formula for an unbiased estimate of the variance changes. For such an estimate, we no longer use the symbol ; we use :
This gives an unbiased estimate of the population variance when using a sample.
Justification of Formula for :
When calculating , we are assuming we have n independent pieces of data. When calculating , we use an estimate of the mean. In order to do this, the process forces our data set to have this mean. This means we have one less degree of freedom — only pieces of independent data. To rectify this, we multiply by , then divide by independent pieces of data we have.
Example:
for independent pieces of data.
for independent pieces of data.
Thus:
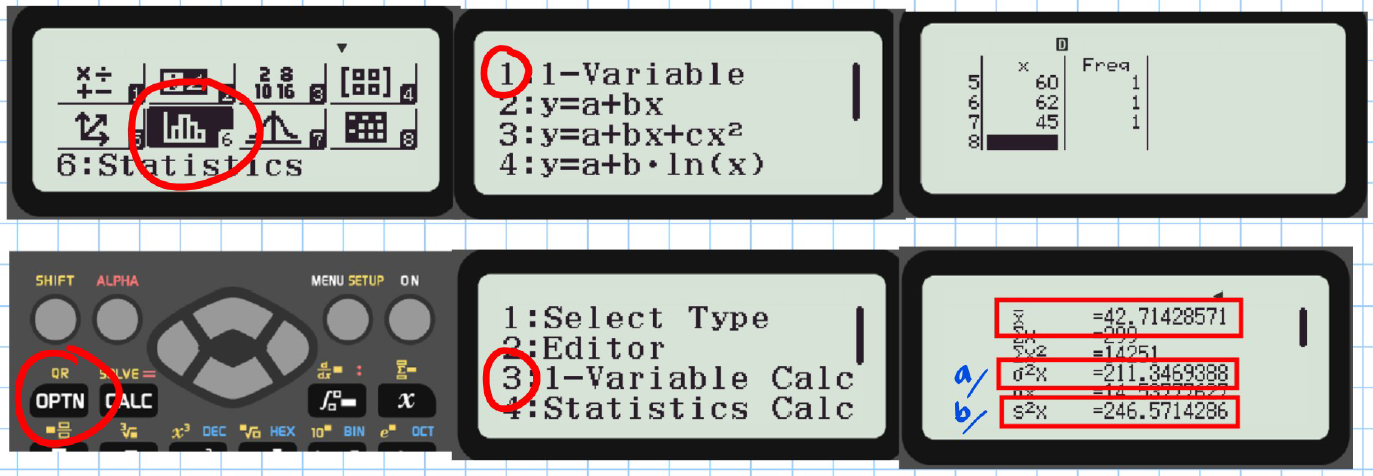
Example: In a test, class scores are as follows:
Calculate:
a) The mean and variance of the scores for the class.
b) Estimate the mean and variance of the test scores across the country.
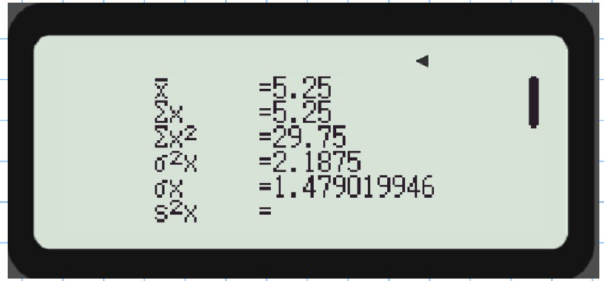
Solving using a calculator:
Note Summary
Key Points:
- When estimating the variance and mean of a population from a sample, use and .
- When you have all the population data, use and .