Exam skills 4 (AQA GCSE Design and Technology): Revision Notes
Exam skills 4: Data interpretation and completion tasks
Understanding data questions
Some exam questions will ask you to interpret data and draw conclusions from the information provided. These questions test your ability to work with numbers, complete missing information, and analyse trends or patterns in data sets.
The key to success with these questions is showing your working clearly and using the given information systematically to find missing values or complete visual representations like tables and graphs.
Data interpretation questions appear frequently in exams because they test multiple skills simultaneously: mathematical calculation, logical reasoning, and clear presentation of working.
Completing tables
When you encounter table completion questions, you need to use the given information to calculate missing values. This often involves basic arithmetic operations like multiplication, division, or finding percentages.
Approach for table questions
Start by identifying what information you already have and what you need to calculate. Look for patterns or relationships between the known values that can help you find the missing ones.
Always identify the known values first, then determine what calculations are needed to find the missing information. This systematic approach prevents errors and ensures you don't miss any steps.
For cost analysis problems, you might need to:
- Multiply monthly costs by 12 to get annual costs
- Multiply annual costs by the number of years
- Compare different options to determine which is more cost-effective
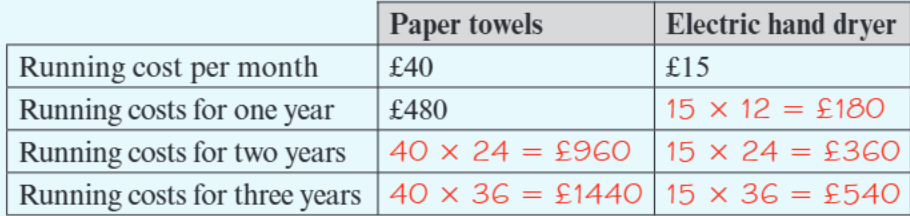
Worked Example: Converting Monthly to Annual Costs
In the example above, you can see how monthly running costs are converted to annual and multi-year totals. The electric hand dryer costs £15 per month, so the annual cost is . For three years, this becomes .
Completing graphs
Graph completion questions require you to plot data points or draw lines that represent the relationship between variables. These questions test your ability to translate numerical data into visual form.
Key tips for graph questions
Essential Graph Drawing Techniques:
Always use a ruler to ensure your lines are straight and accurate. Draw lightly in pencil first, then make your final lines clear and bold. Pay attention to the scale on both axes and make sure your points are plotted correctly.
When drawing cost comparison graphs, you'll often see break-even points where two options become equal in cost. This is where the lines intersect on your graph.
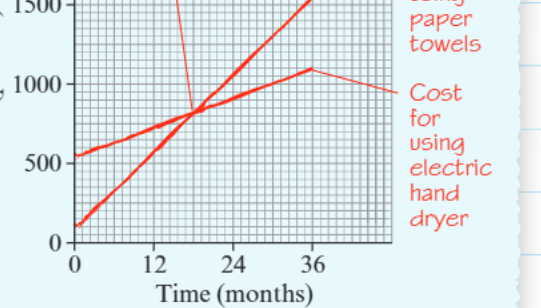 The graph shows how initial costs can be higher for one option (electric hand dryer) but become more economical over time compared to ongoing expenses (paper towels). The intersection point indicates when the electric option becomes cheaper.
Working with energy data
Energy consumption questions often involve calculating percentages and representing data in different formats like pie charts or bar graphs.
| Power source | Total energy consumption in gigawatts (GW) | Percentage of total |
|---|---|---|
| Renewables | 30 | 25 |
| Nuclear | 24 | |
| Coal | 12 | |
| Gas | 48 | |
| Oil and others | 6 | 5 |
| Total | 120 | 100 |
When working with energy data tables, you may need to:
- Calculate missing percentage values by dividing individual amounts by the total
- Ensure all percentages add up to 100%
- Convert the data into visual representations
Worked Example: Calculating Energy Percentages
For the energy table shown, if nuclear power provides 24 GW out of a total 120 GW, the percentage would be:
Step 1: Divide the individual value by the total Step 2: Multiply by 100 to convert to percentage
Essential exam techniques
Critical Exam Success Strategies:
Always show your calculations step by step, even for simple arithmetic. This ensures you can earn partial marks if your final answer is incorrect but your method is right.
Check that your completed tables make mathematical sense. Do the rows and columns add up correctly? Do percentages total 100%?
When drawing graphs, label your axes clearly and include units where appropriate. Use the full range of the graph paper provided and make your lines bold enough to be easily seen.
For data interpretation questions, read the question carefully to understand exactly what type of conclusion or comparison you're being asked to make.
Key Points to Remember:
- Always show your working clearly, even for basic calculations
- Use rulers for accurate graph drawing and check your scale carefully
- Verify that percentages in tables add up to 100% when dealing with complete data sets
- Look for break-even points or intersection points when comparing costs over time
- Double-check your arithmetic and ensure your final answers make logical sense