The sine and cosine graphs (AQA GCSE Further Maths): Revision Notes
The sine and cosine graphs
Understanding trigonometric functions through the unit circle
When we work with trigonometric functions, the unit circle provides us with a powerful visual tool to understand how sine and cosine behave. The unit circle is simply a circle with radius 1, centred at the origin of a coordinate system.
The unit circle is a fundamental tool in trigonometry - it's a circle with radius exactly 1 unit, positioned so its centre is at the origin (0,0) of a coordinate system. This simple setup allows us to visualise how trigonometric functions behave for any angle.
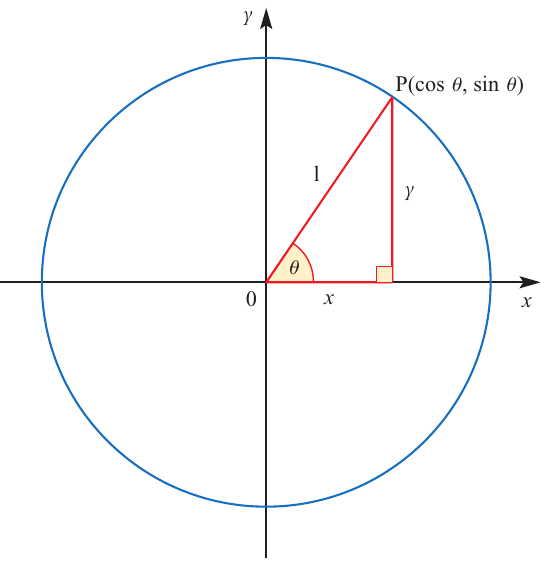
For any angle (theta) measured from the positive x-axis, we can find a point P on the unit circle. This point has very special coordinates: . This means that the x-coordinate of point P equals , and the y-coordinate equals .
The key relationships are:
- y-coordinate of point P
- x-coordinate of point P
- (the ratio of the coordinates)
These definitions work for any angle , whether it's positive, negative, or greater than 90°.
As the angle changes, the signs of and will vary depending on which quadrant point P is located in.
Creating the sine graph
To understand how the sine graph is formed, we can track what happens to the y-coordinates (sine values) as we move around the unit circle.
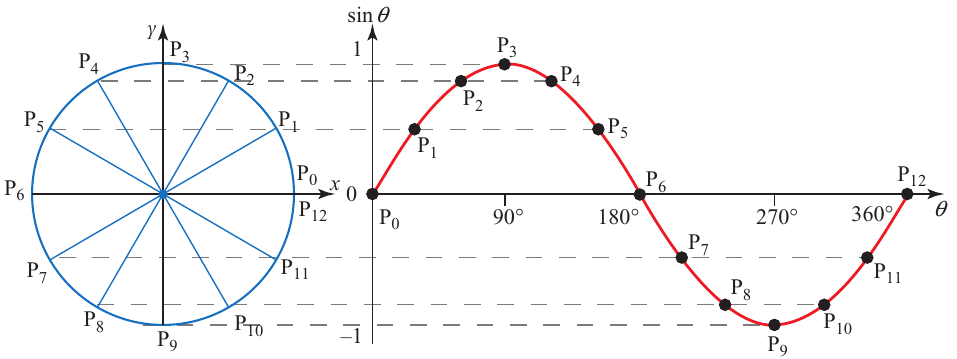
Starting at 0° and moving counterclockwise around the circle, we can plot the sine values at regular intervals. When we connect these points on a graph with on the horizontal axis and on the vertical axis, we get the familiar wave-like sine curve.
Tracking Sine Values Around the Circle:
Starting our journey around the unit circle:
- At : (starting point)
- At : (maximum value)
- At : (back to zero)
- At : (minimum value)
- At : (complete cycle)
Since this pattern repeats itself every 360°, we say that the sine function is periodic with a period of 360°.
Creating the cosine graph
The cosine graph is formed in exactly the same way, but this time we track the x-coordinates (cosine values) as we move around the unit circle.
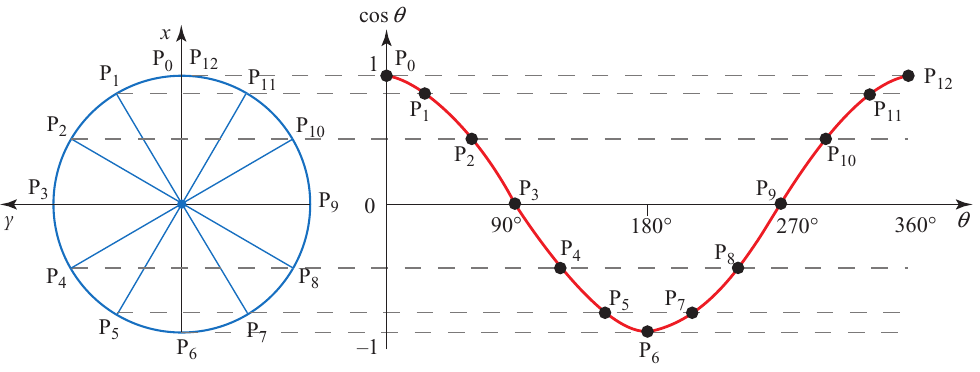
Following the same process, we plot the cosine values at different angles to create the cosine curve. The cosine function behaves differently from sine: it starts at its maximum value of 1 when , decreases to 0 at , reaches its minimum value of -1 at , returns to 0 at , and back to 1 at .
Tracking Cosine Values Around the Circle:
Following the x-coordinates as we move around:
- At : (maximum value at start)
- At : (crosses zero)
- At : (minimum value)
- At : (crosses zero again)
- At : (back to maximum)
Like the sine function, the cosine function is also periodic with a period of 360°.
Comparing sine and cosine graphs
When we plot both functions on the same axes, we can see their relationship more clearly.
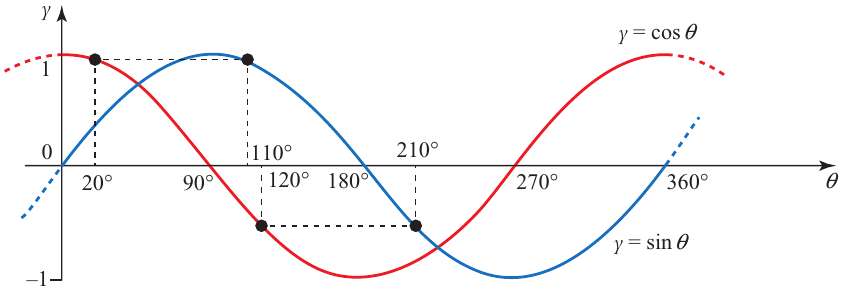
Both graphs have the same wave-like shape and the same period of 360°. However, they are shifted relative to each other. The cosine graph can be obtained by moving the sine graph 90° to the left (or equivalently, the sine graph can be obtained by moving the cosine graph 90° to the right).
Key properties of sine and cosine functions
Range: Both and have values that range from -1 to 1. They never go above 1 or below -1.
Period: Both functions repeat their patterns every 360°. This means that and for any angle .
Amplitude: The amplitude (maximum distance from the centre line) of both functions is 1.
Starting values help identify the graphs:
- - the sine graph passes through the origin
- - the cosine graph starts at its maximum value
This is one of the easiest ways to distinguish between the two graphs!
Symmetry: The sine function has rotational symmetry about the origin, while the cosine function has reflective symmetry about the y-axis.
Common exam tips:
- Remember that both functions oscillate between -1 and 1
- The sine graph passes through the origin (0, 0)
- The cosine graph starts at the point (0, 1)
- Both graphs complete one full cycle every 360°
- When solving problems, always check that your angle is in the correct units (degrees or radians)
- Use the unit circle to verify your answers for special angles like 0°, 90°, 180°, 270°, and 360°
Key Points to Remember:
- The unit circle helps us understand that is the y-coordinate and is the x-coordinate of a point on the circle
- Both sine and cosine functions create wave-like graphs that repeat every 360°
- The range of both functions is from -1 to 1
- The cosine graph is the sine graph shifted 90° to the left
- These periodic functions are fundamental to understanding more complex trigonometric relationships