Numerical and statistical skills 1 (Edexcel GCSE Geography A): Revision Notes
Numerical and statistical skills 1
Understanding numerical and statistical skills is essential for GCSE Geography. These mathematical techniques help you analyse data, interpret patterns, and make sense of geographical information. While these skills are particularly important for specific topics, they can appear in any part of your geography exam.
Key mathematical and statistical terms
Before diving into calculations, it's important to understand the fundamental vocabulary that underpins statistical work in geography.
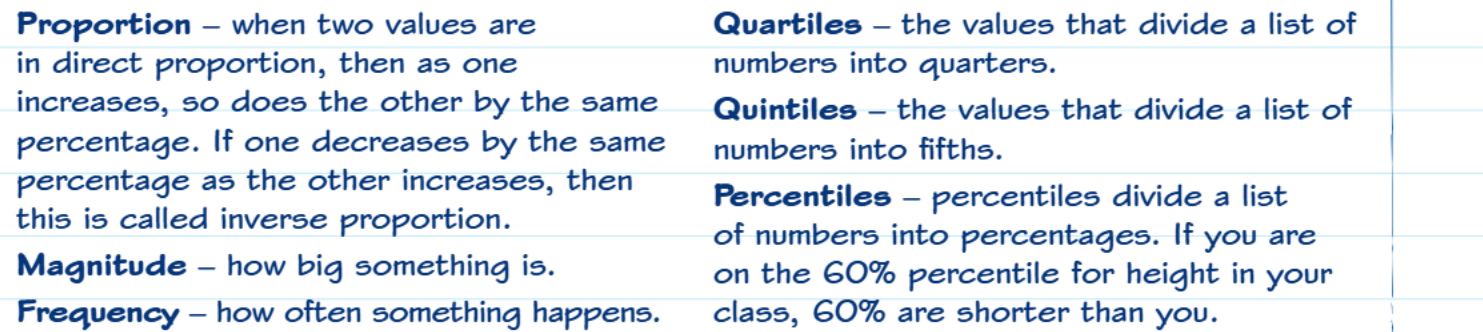
Proportion describes the relationship between two values. When values are in direct proportion, they increase or decrease together by the same percentage. For example, if population doubles, housing demand might also double. Inverse proportion occurs when one value decreases as another increases by the same percentage - such as when distance from a city centre increases, land prices typically decrease.
Magnitude simply refers to how big or significant something is. In geography, this might relate to the size of an earthquake, the scale of migration, or the extent of urban sprawl.
Frequency measures how often something occurs. This could be the number of floods per year, the frequency of bus services, or how often certain weather patterns appear.
Statistical divisions help organise data:
- Quartiles split data into four equal parts, helping you understand the spread of information
- Quintiles divide data into five equal sections
- Percentiles create 100 divisions - if you scored in the 75th percentile for exam results, this means 75% of students scored lower than you
Finding the percentage of an amount
This technique is crucial when you need to calculate a portion of a total value, such as determining how much of a country's population lives in urban areas.

The process involves two straightforward steps. First, convert the percentage to a decimal by dividing by 100. Then multiply this decimal by the total amount you're working with.
Worked Example: Finding Urban Population
If 84% of the UK's 64 million people live in England:
Step 1: Convert percentage to decimal 84 ÷ 100 = 0.84
Step 2: Multiply by total amount
0.84 × 64 = 53.76 million people
This method works for any scenario where you know the percentage and the total, allowing you to find the actual quantity.
Expressing one quantity as a percentage of another
Sometimes you'll have two quantities and need to work out what percentage one represents of the other. This is particularly useful when comparing different aspects of geographical data.

The approach here is to divide the first quantity by the second quantity, then multiply your result by 100 to convert it to a percentage.
Worked Example: Energy Production Percentage
A country produces 32 million tonnes of oil equivalent energy, with 8 million tonnes coming from coal. To find coal's percentage:
Step 1: Divide first quantity by second 8 ÷ 32 = 0.25
Step 2: Multiply by 100 to get percentage 0.25 × 100 = 25%
Therefore, coal represents 25% of the total energy production.
Calculating percentage increase and decrease
Understanding how values change over time is fundamental to geographical analysis, whether you're examining population growth, economic development, or environmental change.

Essential formulas for percentage change:
For percentage increases:
For percentage decreases:
Always divide by the original number - this is the most common mistake students make!
For percentage increases, subtract the original number from the new number to find the increase. Then divide this increase by the original number and multiply by 100.
For percentage decreases, the process is similar but you subtract the new number from the original number first.
These calculations help you quantify change and make meaningful comparisons between different time periods or locations.
Understanding ratios and equivalent ratios
Ratios express the relationship between two or more quantities, showing how many times one value contains another. They're particularly useful for comparing different aspects of geographical data.
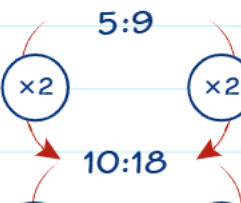
You can create equivalent ratios by multiplying or dividing all parts of the ratio by the same number. This scaling property makes ratios flexible tools for analysis and comparison.
Ratios in geography applications: Ratios can express risk or probability. For example, a flood risk map showing 1:200 indicates there's a one in 200 chance (or greater) of flooding occurring each year in that area.
When working with ratios, remember that they show relative relationships rather than absolute values. This makes them excellent for comparing proportions across different scales or contexts.
Key Points to Remember:
-
Master the two percentage methods: dividing by 100 then multiplying (for percentage of amount), or dividing first then multiplying by 100 (for one quantity as percentage of another)
-
Use the correct formula for percentage change: always subtract in the right direction and divide by the original number
-
Understand that ratios show relationships: they can be scaled up or down by multiplying or dividing both sides by the same number
-
Learn key statistical vocabulary: terms like quartiles, percentiles, and frequency will appear throughout your geography studies
-
Practice with real geographical data: these skills become more meaningful when applied to actual population figures, economic data, or environmental measurements