Numerical and statistical skills 2 (Edexcel GCSE Geography A): Revision Notes
Numerical and statistical skills 2
Understanding averages and measures of central tendency is essential for managing and comparing data sets. These statistical tools help us describe data clearly and make meaningful comparisons. The key measures you need to master include the median, mean, range, quartiles, interquartile range, mode, and modal class.
Mode
The mode represents the value that appears most frequently in a data set. When examining a collection of numbers, you simply identify which value occurs more often than any other.
Worked Example: Finding the Mode
For the data set: 4, 5, 9, 7, 4, 4
The number 4 appears three times whilst all other numbers appear only once, making 4 the mode.
If no number repeats, then there is no mode. If two or more numbers appear with the same highest frequency, the data set has multiple modes.
Mean
The mean, commonly known as the average, is calculated by adding all values together and then dividing by the total number of values. This gives you a central value that represents the entire data set.
To calculate the mean:
- Add all the numbers together
- Divide by how many numbers you have
- Keep your answer precise without rounding
Worked Example: Calculating the Mean
Using the data set: 4, 5, 9, 7, 4, 4
Step 1: Add all values together
Step 2: Divide by the number of values Mean =
Always keep your mean answer precise without rounding unless specifically asked to do so. This maintains accuracy for further calculations.
Median
The median is the middle value when all numbers are arranged in ascending order from smallest to largest. If you have an even number of values, the median sits halfway between the two middle numbers.
To find the median:
- Arrange all values in ascending order
- Locate the middle position
- If there are two middle values, calculate their average
Worked Example: Finding the Median
For the data set: 4, 5, 9, 7, 4, 4
Step 1: Arrange in ascending order 4, 4, 4, 5, 7, 9
Step 2: Find the middle position With 6 numbers, the median lies between positions 3 and 4
Step 3: Calculate the average of the middle values Median =
Range
The range measures how spread out your data is by calculating the difference between the highest and lowest values. This gives you an understanding of the data's variability.
Worked Example: Calculating the Range
For the data set: 4, 5, 9, 7, 4, 4
Range =
The range is sensitive to extreme values (outliers). A single very high or very low value can make the range much larger than expected.
Modal class
When working with grouped data, the modal class is the group or category that contains the highest frequency of values. This concept is particularly useful when dealing with data that has been organised into intervals or ranges.
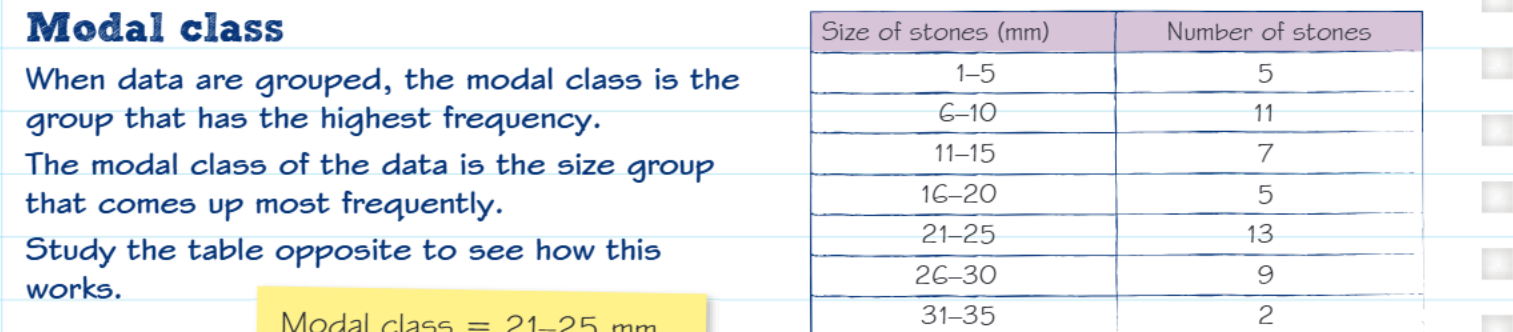
Looking at the frequency table, you can see that the size group 21-25 mm contains 13 stones, which is higher than any other group. Therefore, the modal class is 21-25 mm.
Quartiles and interquartile range
Quartiles divide your data into four equal parts, providing a more detailed view of how values are distributed. The median acts as the middle point, whilst quartiles show you the spread within each half of the data.
The lower quartile marks the point that divides the bottom half of the data into two equal parts. The upper quartile does the same for the top half. The interquartile range measures the spread between these two quartiles.
Calculating quartiles
You can use these formulas to find quartile positions:
- Median position:
- Lower quartile position:
- Upper quartile position:
Worked Example: Finding Quartiles
Consider the data set: 2, 5, 5, 7, 9, 11, 13
With numbers:
Step 1: Find positions
- Median position: th value
- Lower quartile position: nd value
- Upper quartile position: th value
Step 2: Identify values
- Median = 7 (4th value)
- Lower quartile = 5 (2nd value)
- Upper quartile = 11 (6th value)
Step 3: Calculate interquartile range Interquartile range =
The interquartile range is less affected by extreme values than the range, making it a more reliable measure of spread for skewed data.
Key Points to Remember:
- Mode - The value that occurs most frequently in your data set
- Mean - Add all values together and divide by the number of values (don't round your answer)
- Median - The middle value when data is arranged in order from smallest to largest
- Range - The difference between the largest and smallest values, showing data spread
- Modal class - In grouped data, this is the group with the highest frequency of values