Data Collection and Sampling (OCR GCSE Geography B (Geography for Enquiring Minds)): Revision Notes
Data collection and sampling
Introduction to fieldwork
Fieldwork is the process of gathering information or data about real places and environments. It is an essential part of geographical investigations, allowing you to test ideas and understand patterns in the real world.
Data collected during fieldwork can be divided into two main categories:
Quantitative data includes factual information that you can measure or count. This type of data is based on numbers and can be used to identify patterns and trends. For example, you might count the number of pedestrians passing a specific point or measure river velocity.
Qualitative data is based on opinions, descriptions and observations. Although it is more subjective than quantitative data, it remains valuable for understanding people's perceptions and experiences of places.
The key difference: Quantitative data answers "how many" or "how much," while qualitative data answers "what is it like" or "how does it feel." Both types are valuable and often work together to provide a complete picture of your study area.
Primary and secondary data
When conducting fieldwork, you will work with two types of data sources:
Primary data is information that you gather yourself during your fieldwork. Examples include:
- Tally counts of traffic or pedestrians
- Measurements such as temperature or river width
- Photographs you take at your field site
- Questionnaire responses you collect directly from people
Secondary data is information that has already been gathered by others and made available for use. Examples include:
- Census statistics from the internet
- Historical maps
- Weather data from meteorological services
- Published research findings
Using Both Data Types Effectively
The most successful fieldwork investigations combine primary and secondary data. Primary data allows you to investigate your specific research questions, while secondary data provides context and comparison. For example, you might compare your traffic counts (primary) with historical traffic data from local authorities (secondary) to identify trends.

Data collection sheets
Well-designed data collection sheets are crucial for successful fieldwork. They should be clear, organized and easy to use in the field. Simple methods of recording information lead to accurate data collection, which in turn allows you to draw reliable conclusions.
When designing your data collection sheets, consider:
- Clear headings for each type of information
- Sufficient space to record measurements
- Simple formats that minimize errors
- Categories that match your investigation questions
Design Tips for Data Collection Sheets
Before heading out for fieldwork, test your data collection sheets with a small pilot study. This helps you identify any problems with your design, such as missing categories or confusing headings. It's much easier to fix these issues before collecting all your data than to realize afterwards that your sheets were poorly designed!
Data sampling techniques
Collecting enough data is important to ensure your findings are representative. However, you must avoid bias in your data collection. Bias occurs when your sample does not accurately represent the wider population or area you are studying.
Understanding Bias in Sampling
For example, if investigating opinions about urban facilities, asking only young people might give biased results because they may prefer different facilities (such as skate parks) compared to older people (who might prefer cafes or gyms). Asking a mixture of different age groups provides a more balanced view.
Bias can also occur in spatial sampling. Measuring river depth only in shallow areas would bias your results and give an incomplete picture of the channel characteristics.
Random sampling
Random sampling involves selecting people to interview or sites to measure entirely by chance. This technique is unbiased because you do not specifically choose particular people or places. For example, you might use random number tables to select house numbers for a survey, or throw a quadrat randomly to select vegetation sampling points.
Worked Example: Random Sampling for a Survey
You want to survey 30 houses in a street with 150 houses to investigate household recycling habits.
Step 1: Assign each house a number from 1 to 150
Step 2: Use a random number generator or random number table to select 30 numbers
Step 3: Survey the houses corresponding to those random numbers
This approach ensures every house has an equal chance of being selected, eliminating your personal bias in choosing which houses to survey.
Systematic sampling
Systematic sampling means collecting data in an ordered or regular pattern. Examples include:
- Measuring river depth every 5 metres across a channel
- Interviewing every fifth person who passes a location
- Taking soil samples every 10 metres along a transect
This approach ensures even coverage of your study area and can reveal spatial patterns.
Worked Example: Systematic Sampling Across a River
You are investigating how river depth changes across a channel that is 20 metres wide.
Step 1: Choose your sampling interval (e.g., every 2 metres)
Step 2: Starting from the left bank, measure depth at 0m, 2m, 4m, 6m, 8m, 10m, 12m, 14m, 16m, 18m, and 20m
Step 3: This gives you 11 measurements evenly distributed across the channel
This systematic approach allows you to identify patterns in depth variation and create an accurate cross-section profile of the river.
Stratified sampling
Stratified sampling involves dividing your sample into groups or categories before collecting data. For example:
- Taking three measurements from each section of coastline
- Interviewing five people from each age range
- Sampling different land use types proportionally
You can combine stratified sampling with the other techniques:
- Stratified random sampling: randomly selecting samples from within each category
- Stratified systematic sampling: taking regular samples from within each category
Worked Example: Stratified Random Sampling
You want to survey 60 people about a new shopping development, ensuring all age groups are represented. The local population breakdown is: 20% under 18, 50% aged 18-60, 30% over 60.
Step 1: Calculate samples per category
- Under 18: people
- Aged 18-60: people
- Over 60: people
Step 2: Randomly select the required number from each age group
This ensures your sample reflects the actual population structure, making your results more representative.
Quantitative data
Quantitative data is presented in numerical form and can be analyzed statistically. Many different things can be measured during fieldwork, such as:
- River velocity
- Number of vehicles passing a point
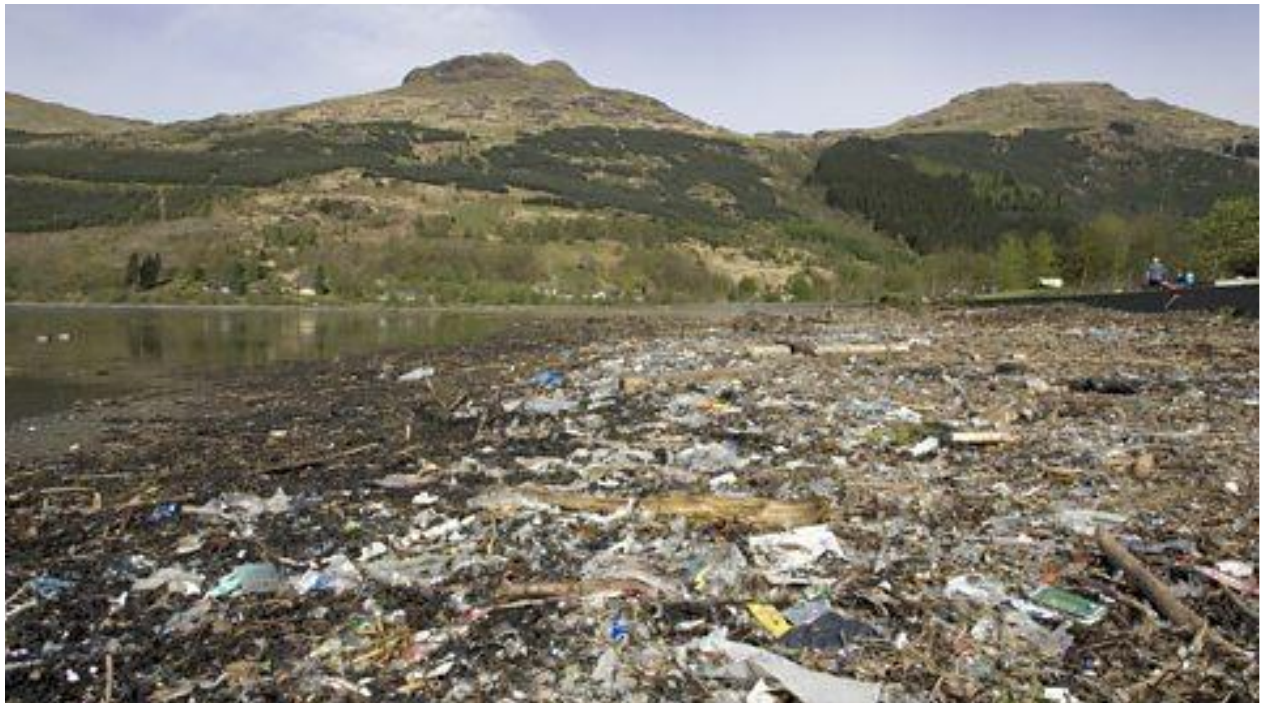
- Amount of litter in a location
- Temperature readings
- Building heights
Types of quantitative data
Quantitative data can take several different forms:
Nominal data consists of numbers used as categories rather than for mathematical calculations. For example:
- 1 = yes, 2 = no
- 1 = detached house, 2 = semi-detached house, 3 = terraced house
With nominal data, the numbers are simply labels or codes. You cannot perform meaningful mathematical operations like addition or averaging with these numbers - they're just convenient ways to categorize information.
Ordinal data consists of numbers that have a ranking order. You know the relative position of each value, but not the precise difference between them. For example:
- Ranking cities by population size (1st, 2nd, 3rd)
- You know city 1 has more people than cities 2 and 3, but the spacing between each rank is not equal
Ordinal data tells you the order but not the magnitude of difference. The gap between 1st and 2nd place might be huge, while the gap between 2nd and 3rd might be tiny.
Interval data is similar to ordinal data, but the difference between each number is equal and consistent. For example:
- Temperature measured in degrees Celsius
- Each degree represents the same amount of temperature change
Interval data has equal intervals between values, making it more powerful for statistical analysis. However, interval scales don't have a true zero point (0°C doesn't mean "no temperature").
Ratio data shows a relationship between two sets of numbers. For example:
- Number of people per doctor
- Population density (people per square kilometre)
- Average income per household
Ratio data has both equal intervals and a true zero point. This means you can make meaningful statements like "twice as many" or "half as much." For example, a population density of 200 people/km² is genuinely twice as dense as 100 people/km².
Qualitative data
Qualitative data does not need to be in numerical form. Instead, it consists of words, descriptions and images that provide context and detail about places.
Types of qualitative data
Questionnaires are used to gather people's opinions and perceptions. They are effective for understanding what people think about places, issues or changes. However, questionnaires may be less accurate when trying to establish factual information, as people's memories or knowledge may be incomplete.
Designing Effective Questionnaires
Good questionnaire design is essential for collecting useful qualitative data. Use clear, unbiased questions and consider including a mix of open questions (allowing detailed responses) and closed questions (providing specific options). Always pilot your questionnaire first to identify confusing questions or missing response options.
Field sketches and photographs provide visual records of landscapes and locations. These can be:
- Photographs taken with a camera
- Hand-drawn sketches made in the field
Field sketches and photographs serve as valuable reminders of what a place looks like and can help you identify features and changes over time.
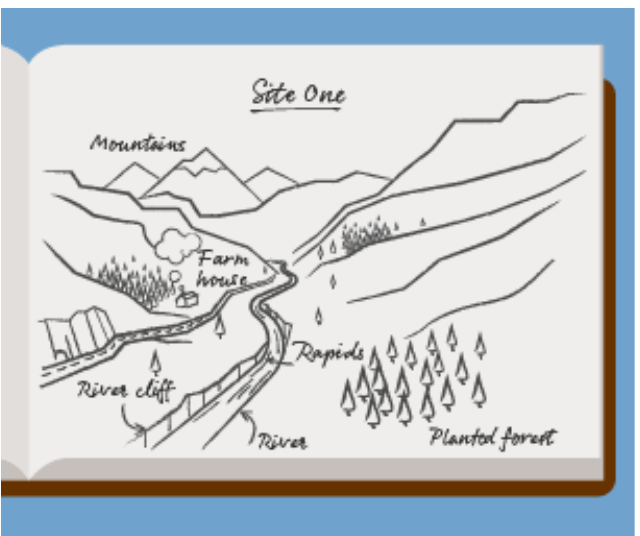
Field sketches have advantages over photographs in some situations. You can emphasize important features, add labels directly onto the sketch, and capture details that might be difficult to photograph. However, photographs provide accurate, unbiased records of the actual scene.
Maps provide spatial information about places and can show patterns and distributions. Maps used in fieldwork include:
- Hand-drawn sketch maps
- Ordnance Survey maps from the internet
- Satellite images
- GIS (Geographic Information System) maps
Maps help you understand the layout of areas, identify features and analyze spatial relationships.
Remember!
Key Points to Remember:
- Quantitative data is numerical and measurable, while qualitative data is descriptive and based on observations or opinions
- Primary data is what you collect yourself; secondary data is collected by others
- Avoid bias by using appropriate sampling techniques: random, systematic or stratified
- Design clear data collection sheets to ensure accurate recording
- Different types of quantitative data (nominal, ordinal, interval, ratio) have different uses in analysis
- Qualitative data (questionnaires, sketches, maps) provides important context and detail for your investigation