Climate Change Fieldwork (OCR GCSE Geography B (Geography for Enquiring Minds)): Revision Notes
Climate change fieldwork
Introduction to studying climate change in the field
Climate change creates numerous impacts on our environment, including rising sea levels, changes to plant species, and increased flooding events. Many of these impacts occur gradually over extended periods, making them difficult to observe through short-term fieldwork investigations. However, certain climate-related issues, particularly flooding impacts, can be effectively studied through fieldwork because their consequences are visible and measurable within local areas.
While most climate change impacts take decades to become observable, flooding provides an immediate and measurable case study that can be investigated within the timeframe of typical geographical fieldwork projects.
Why flooding is suitable for fieldwork investigation
Flooding caused by rising sea levels or increased river flow represents an ideal topic for geographical fieldwork. Unlike gradual climate changes that take decades to observe, the impacts of flooding can be assessed relatively quickly through field investigations. Both coastal and river flooding create tangible effects on communities, infrastructure and the built environment that can be measured and recorded during a fieldwork study.
The key advantages of studying flooding through fieldwork include:
- Visible and measurable impacts on the local environment
- Effects that can be observed within a single field trip
- Clear connections between cause and effect
- Availability of both primary and secondary data sources
Understanding data types in fieldwork
When conducting a flooding investigation, geographers use two distinct categories of information. Primary data refers to information that you gather yourself through direct fieldwork activities such as completing questionnaires, taking measurements, or conducting surveys. In contrast, secondary data consists of information that has already been collected and published by other organisations or researchers. Both types of data provide valuable insights when investigating flooding impacts.
Understanding the distinction between primary and secondary data is essential for planning your fieldwork investigation. Primary data allows you to gather specific information tailored to your research question, while secondary data provides context and background information that would be difficult or time-consuming to collect yourself.
Primary data collection methods
There are several practical approaches to collecting first-hand information about flooding impacts during fieldwork:
Economic impact survey: This method involves calculating the financial costs that flooding would cause to properties and businesses in an area. You would identify different types of properties (such as small houses, medium houses, large houses and commercial premises), estimate typical flood damage costs for each category, and multiply these values to determine total potential losses for a street or neighbourhood.
Social impact survey: This approach focuses on identifying which essential community services might be affected by flooding. You would map the locations of critical facilities like hospitals, fire stations, schools and care homes to understand how flooding could disrupt vital services that communities depend upon.
Social impact surveys help reveal the broader consequences of flooding beyond property damage, showing how entire communities might be affected through disruption to healthcare, education, and emergency services.
Annotated sketch or photograph: By creating a detailed sketch or taking photographs of an area at risk, you can mark potential flood impacts directly onto the image. This visual method helps identify vulnerable features such as ground-floor properties, electrical installations, or transport links.
Questionnaire: Speaking directly with local residents provides insights into how individuals perceive flood risks and how they might be personally affected. Questions could explore people's awareness of flood risks, their preparedness measures, and concerns about potential impacts on their homes or daily lives.
Role play exercise: This method involves considering flooding from different perspectives by imagining how various members of the community might experience the impacts. For example, you might consider the concerns of an elderly pensioner living alone compared to a family with young children or a business owner.
Secondary data sources
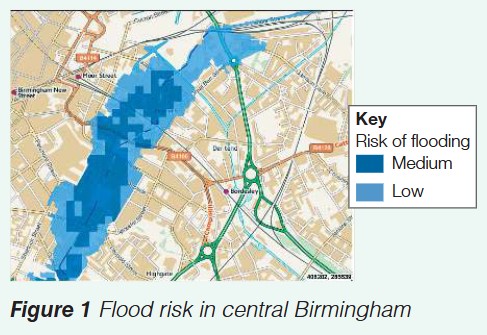
The Environment Agency provides valuable secondary data through its interactive online flood risk maps. These digital maps identify areas classified as being at medium or low risk of flooding, helping researchers understand which locations are most vulnerable.
Online census information offers additional secondary data by providing demographic details about areas that might face flooding. This data helps researchers understand population characteristics, housing types and community composition in flood-risk zones.
Secondary data from the Environment Agency and census information can be used to:
- Verify your primary data findings
- Provide context for your fieldwork observations
- Identify areas where primary data collection would be most valuable
- Support your conclusions with established datasets
Example: Economic impact survey
Worked Example: Calculating Economic Impact
An economic impact survey demonstrates how primary data collection can quantify flooding costs. The investigation involves several key steps:
Step 1: Identify and count different property types in each street
- Small houses and ground-floor flats
- Medium houses
- Large houses
- Business premises
Step 2: Apply standard flood damage costs for each property type
- Small houses: £20,000 per property
- Medium houses: £30,000 per property
- Large houses: £40,000 per property
- Business premises: £30,000 per business
Step 3: Calculate total costs by multiplying property numbers by damage estimates
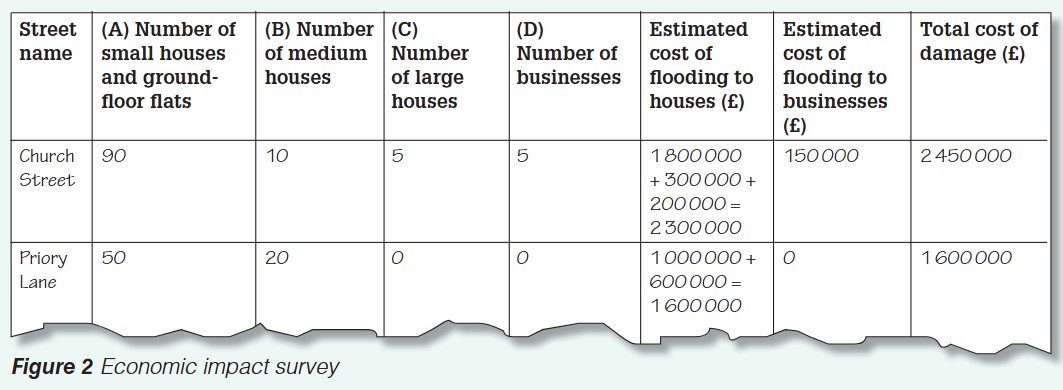
| Street name | (A) Number of small houses and ground-floor flats | (B) Number of medium houses | (C) Number of large houses | (D) Number of businesses | Estimated cost of flooding to houses (£) | Estimated cost of flooding to businesses (£) | Total cost of damage (£) |
|---|---|---|---|---|---|---|---|
| Church Street | 90 | 10 | 5 | 5 | 1,800,000 + 900,000 + 200,000 = 2,900,000 | 150,000 | 2,450,000 |
| Priory Lane | 50 | 20 | 0 | 0 | 1,000,000 + 600,000 = 1,600,000 | 0 | 1,600,000 |
Step 4: Compare results between different streets to identify priority areas
In this example, Church Street faces significantly higher economic costs (£2,450,000) compared to Priory Lane (£1,600,000), making it a higher priority for flood defence measures.
This survey approach allows for direct comparison between different streets or neighbourhoods, revealing which areas would suffer the greatest economic losses from flooding events. The data collected can support planning decisions and flood defence prioritisation.
Exam guidance
Understanding Exam Command Words
When answering questions about fieldwork methods, pay close attention to the command word used:
-
Describe questions require you to outline the key features of a method without explanation. Focus on "what" you would do, not "why" you would do it.
-
Explain questions need you to give reasons why a particular method is appropriate for studying flooding. Use connectives like "because," "therefore," and "this means that."
-
Evaluate questions ask you to weigh up the advantages and limitations of different approaches. Consider both strengths and weaknesses, and reach a balanced judgment.
Always link your fieldwork methods to the specific geographical issue being investigated. Generic descriptions of methods without context to flooding will not achieve full marks.
Remember!
Key Points to Remember:
About Climate Change Fieldwork:
- Many climate change impacts occur too slowly to study through short-term fieldwork, but flooding impacts can be effectively investigated
- Flooding provides visible and measurable consequences that can be observed within a single field trip
- Both coastal and river flooding create tangible effects suitable for fieldwork investigation
About Data Collection:
- Primary data is collected by you directly through fieldwork activities, whilst secondary data has been gathered by others
- Economic impact surveys calculate potential financial losses by multiplying property numbers by estimated damage costs
- Social impact surveys identify vulnerable community services like hospitals and emergency services
- The Environment Agency provides useful secondary data through flood risk maps
Critical Processes:
- Identifying suitable climate change topics for fieldwork investigation
- Selecting appropriate data collection methods for your research question
- Combining primary and secondary data sources for comprehensive analysis
- Quantifying impacts through systematic surveys and calculations
Key Terms:
- Primary data: Information collected first-hand through your own fieldwork
- Secondary data: Information already collected and published by other organisations
- Economic impact: The financial costs and losses caused by flooding
- Social impact: The effects of flooding on community services and people's lives