Evidence of Climate Change (OCR GCSE Geography B (Geography for Enquiring Minds)): Revision Notes
Evidence of Climate Change
Understanding climate change requires examining multiple sources of evidence collected over many years. Scientists use various methods to track how Earth's climate has changed over time, from analyzing ancient ice to monitoring current temperature trends. This evidence helps us determine whether climate change is occurring and whether it results from natural processes or human activities.
Climate evidence comes from multiple independent sources that all point to the same conclusion. When different types of evidence—from ice cores, satellites, and temperature records—all show the same warming trend, this strengthens our confidence in the findings.
Ice cores as climate evidence
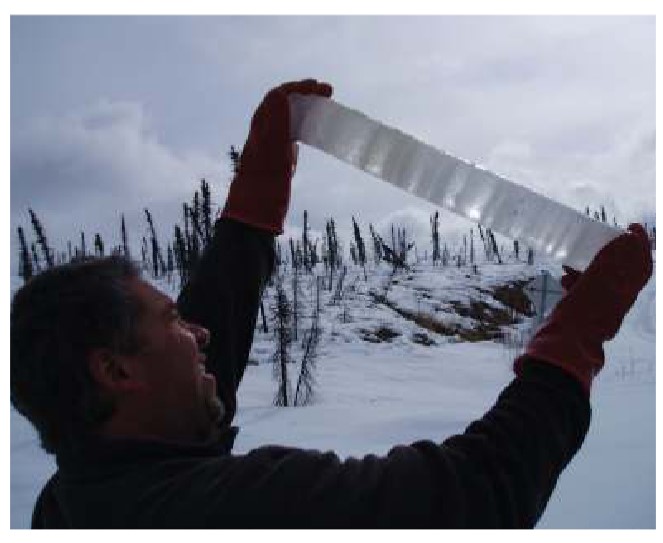
Ice cores provide some of the most valuable evidence for understanding past climates. These cylindrical ice samples are extracted from polar regions, particularly the Arctic and Antarctic ice sheets. Scientists drill deep into the ice, removing long columns that can extend hundreds of meters below the surface.
Each layer within an ice core represents a specific year's snowfall. The snow that fell in a particular year became compressed into ice, trapping tiny air bubbles that preserve atmospheric gases from that time. By analyzing these trapped gases, particularly carbon dioxide (), researchers can determine past temperatures. Higher concentrations of indicate that Earth's temperature was warmer during that year.
How Ice Cores Work
Ice cores act like time capsules. Each layer of ice contains air bubbles that preserve the exact composition of the atmosphere from when that snow fell. Lighter-colored layers typically represent summer snowfall, while darker layers indicate winter. By counting these layers, scientists can date each section of the core, similar to counting tree rings.
Ice cores provide climate evidence spanning approximately 800,000 years. This extended timeframe allows scientists to study climate patterns across multiple ice ages and warmer periods, revealing natural climate cycles that occurred long before human influence.
The reliability of ice core evidence is well established. Scientists have compared recent ice core data with modern temperature measurements recorded by weather stations. This comparison validates the ice core method, confirming it as an accurate source of climate information. The consistency between ice core data and instrumental records strengthens confidence in using ice cores to understand ancient climates.
Satellite monitoring of sea ice
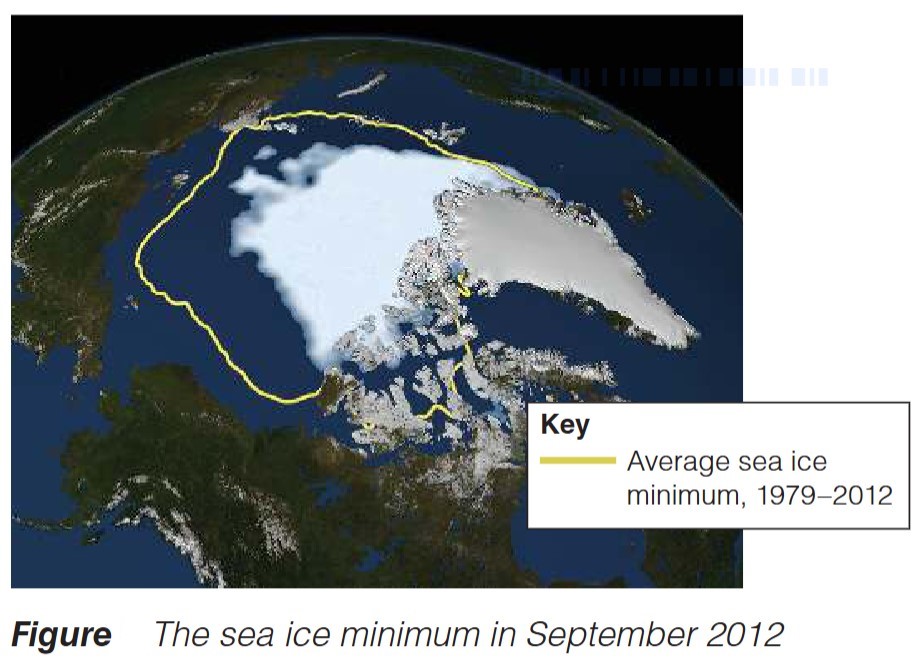
Satellite technology enables scientists to monitor the extent of frozen sea ice covering Arctic waters. These satellite images show how much of the Arctic Ocean remains frozen throughout the year. Sea ice coverage varies seasonally, reaching its minimum extent each September at the end of the summer melting season and its maximum extent in March following winter freezing.
Long-term satellite observations from 1979 to 2014 reveal a concerning trend. The extent of Arctic sea ice at its annual minimum point is steadily decreasing. Year after year, less ice remains at the end of summer compared to previous decades. This shrinking sea ice minimum represents clear evidence of global warming.
Why September and March Matter
September represents the end of summer in the Arctic, when ice melting is at its peak—this gives us the annual minimum. March marks the end of winter, when ice formation is complete—providing the annual maximum. By tracking both measurements, scientists can monitor not just seasonal variation but long-term trends in ice coverage.
Scientists consider this declining sea ice trend particularly significant because satellite monitoring provides objective, consistent measurements. Unlike some other evidence sources, satellites use standardized instruments that measure ice coverage uniformly across vast areas, making the data highly reliable for tracking changes over time.
Global temperature records
Weather stations distributed worldwide record daily temperatures, allowing scientists to calculate the average global temperature each year. These systematic temperature measurements began in 1880, providing over 140 years of climate data.
Analysis of this temperature record reveals a clear warming trend, particularly in recent decades. Nine of the ten hottest years recorded since measurements began have occurred after 2002. This concentration of record-breaking years in such a short recent period strongly indicates that Earth's climate is warming rapidly.
Critical Pattern Recognition
The concentration of the hottest years in such a recent period (nine out of ten since 2002) is statistically significant. This pattern cannot be explained by natural climate variability alone and provides compelling evidence of accelerated warming in recent decades.
| Rank | Year | °C warmer than average |
|---|---|---|
| 1 | 2014 | 0.69 |
| 2 | 2010 | 0.65 |
| 2 | 2005 | 0.65 |
| 4 | 1998 | 0.63 |
| 5 | 2013 | 0.62 |
| 5 | 2003 | 0.62 |
| 7 | 2002 | 0.61 |
| 8 | 2006 | 0.60 |
| 9 | 2009 | 0.59 |
| 9 | 2007 | 0.59 |
The table above shows that 2014 ranks as the warmest year on record, measuring 0.69°C above the historical average.
However, reliability issues exist with temperature data, particularly for historical records. Early temperature measurements were not collected using equipment as accurate as modern instruments. Additionally, the positioning of recording instruments affects measurements. For example, a thermometer placed at the top of a hill might record different temperatures than one in a valley, potentially creating misleading records for that location's actual temperature.
Despite these limitations with older data, modern temperature records from the past several decades are highly reliable, using standardized equipment and placement protocols worldwide.
Historical evidence from paintings and diaries
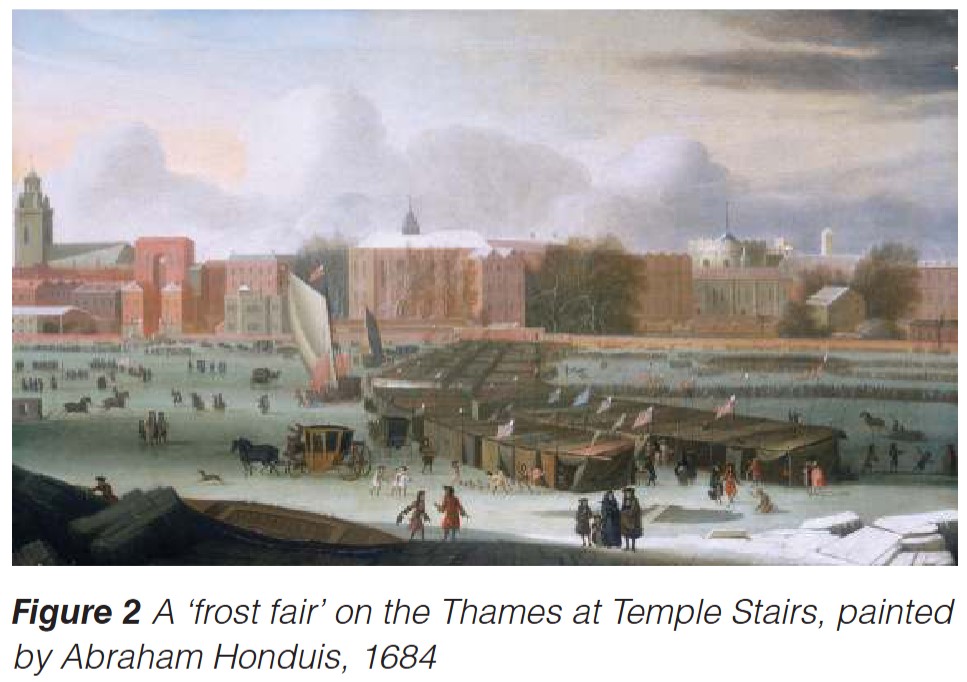
Before systematic temperature recording began, paintings and diary entries provide glimpses into past climates. These historical documents can reveal information about Earth's climate during periods before weather stations existed.
London's River Thames provides a notable example. Historical records, including paintings and diary entries, document that the Thames froze solid regularly between 1309 and 1814. During these cold periods, Londoners held "frost fairs" on the frozen river, with vendors selling goods and people skating on the ice. These events indicate that winters were significantly colder during this period, known as the Little Ice Age.
Limitations of Historical Evidence
Paintings and diaries are not particularly reliable as climate evidence for several key reasons:
- They document day-to-day weather conditions rather than long-term climate patterns. A particularly cold winter captured in a painting does not necessarily indicate a colder overall climate.
- They represent one person's interpretation or artistic representation of weather conditions, introducing subjectivity that scientific instruments avoid.
- They lack the precision, standardization, and objectivity of scientific measurements.
While historical documents provide valuable context for understanding climates before modern data collection, they cannot match the reliability and objectivity of scientific evidence from ice cores, satellite observations, and systematic temperature measurements.
Evaluating evidence reliability
When assessing climate change evidence, reliability is crucial. Scientific evidence from ice cores, satellite monitoring, and modern temperature records provides the most reliable data. These methods use objective measurements that can be verified and compared across different sources.
Ice cores offer particular value because trapped gases provide direct chemical evidence of past atmospheric conditions. The validation of ice core data against modern temperature records confirms this method's accuracy.
Evidence Reliability Hierarchy
Most Reliable (Scientific Evidence):
- Ice cores: Direct chemical evidence of past atmospheres
- Satellite observations: Standardized, consistent measurements
- Modern temperature records: Calibrated instruments with protocols
Less Reliable (Historical Evidence):
- Paintings and diaries: Subjective interpretations of weather, not climate
Satellite observations provide consistent, standardized measurements across large areas, making them excellent for tracking changes in sea ice extent. Modern temperature records, collected using calibrated instruments following standardized protocols, offer reliable data for recent decades.
Historical sources like paintings and diaries have lower reliability because they document weather rather than climate, reflect individual perceptions, and lack the precision of scientific instruments. Nevertheless, they provide useful supplementary evidence for periods before systematic data collection began.
Key Points to Remember:
- Ice cores from polar regions contain trapped gases that reveal Earth's temperature up to 800,000 years ago; levels indicate warmer or cooler periods.
- Satellite data shows Arctic sea ice extent at its September minimum is decreasing over time, providing evidence of global warming.
- Nine of the ten hottest years since temperature recording began in 1880 have occurred after 2002, with 2014 being the warmest (0.69°C above average).
- Scientific evidence (ice cores, satellites, weather stations) is more reliable than historical evidence (paintings, diaries) because it provides objective measurements rather than subjective interpretations.
- Multiple independent evidence sources pointing to the same conclusion—Earth is warming—strengthens confidence in climate change science.