The table of figures shows birth rates, death rates and natural population changes in a selection of countries - Junior Cycle Geography - Question (i) - 2007
Question (i)
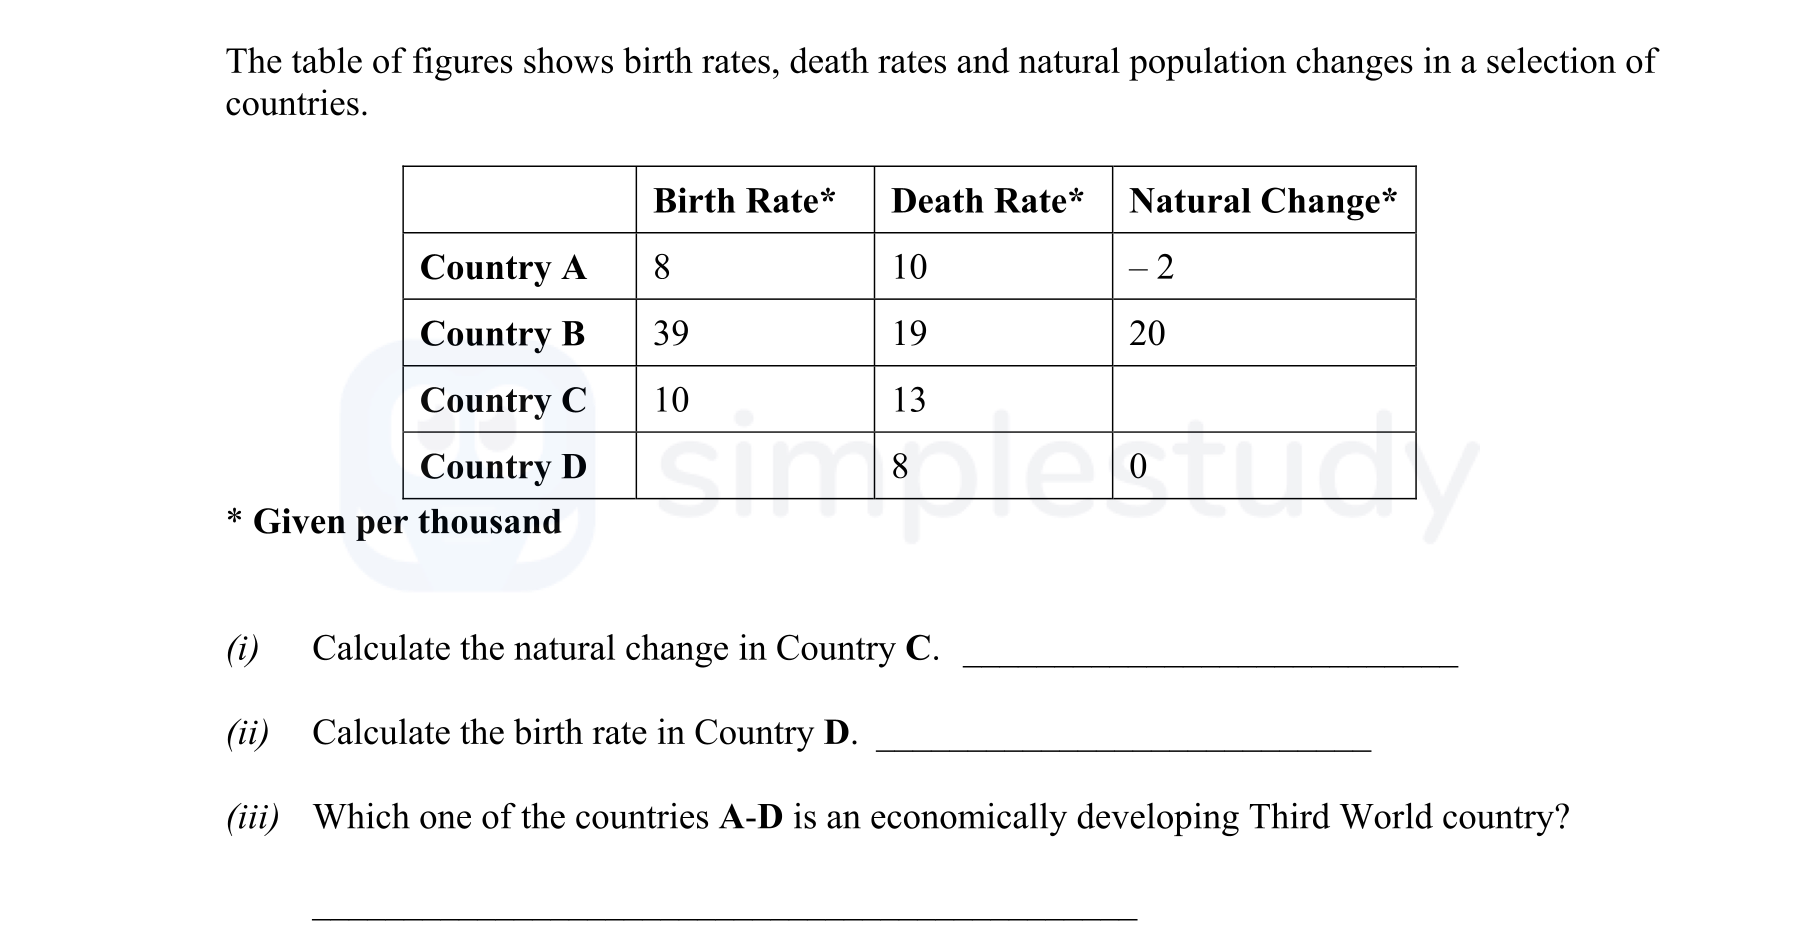
The table of figures shows birth rates, death rates and natural population changes in a selection of countries.
| | Birth Rate* | Death Rate* | Natural... show full transcript
Worked Solution & Example Answer:The table of figures shows birth rates, death rates and natural population changes in a selection of countries - Junior Cycle Geography - Question (i) - 2007
Step 1
Calculate the natural change in Country C.
96%
114 rated
Only available for registered users.
Sign up now to view full answer, or log in if you already have an account!
Answer
To calculate the natural change in Country C, we use the formula:
Natural Change=Birth Rate−Death Rate
Substituting the values from the table for Country C:
Natural Change=10−13=−3
Thus, the natural change in Country C is -3.
Step 2
Calculate the birth rate in Country D.
99%
104 rated
Only available for registered users.
Sign up now to view full answer, or log in if you already have an account!
Answer
According to the table, the birth rate in Country D is given as:
Birth Rate=8
Thus, the birth rate in Country D is 8.
Step 3
Which one of the countries A-D is an economically developing Third World country?
96%
101 rated
Only available for registered users.
Sign up now to view full answer, or log in if you already have an account!
Answer
Country B, with a high birth rate of 39 and a natural change of 20, suggests rapid population growth, characteristic of Third World countries. Additionally, lower death rates reflect improvements in health care and living conditions but still indicate developing status compared to more developed nations.
Join the Junior Cycle students using SimpleStudy...