The graphs give information on the emission of CO₂ and other gases in the European Union (EU) - Junior Cycle Geography - Question 1 - 2007
Question 1
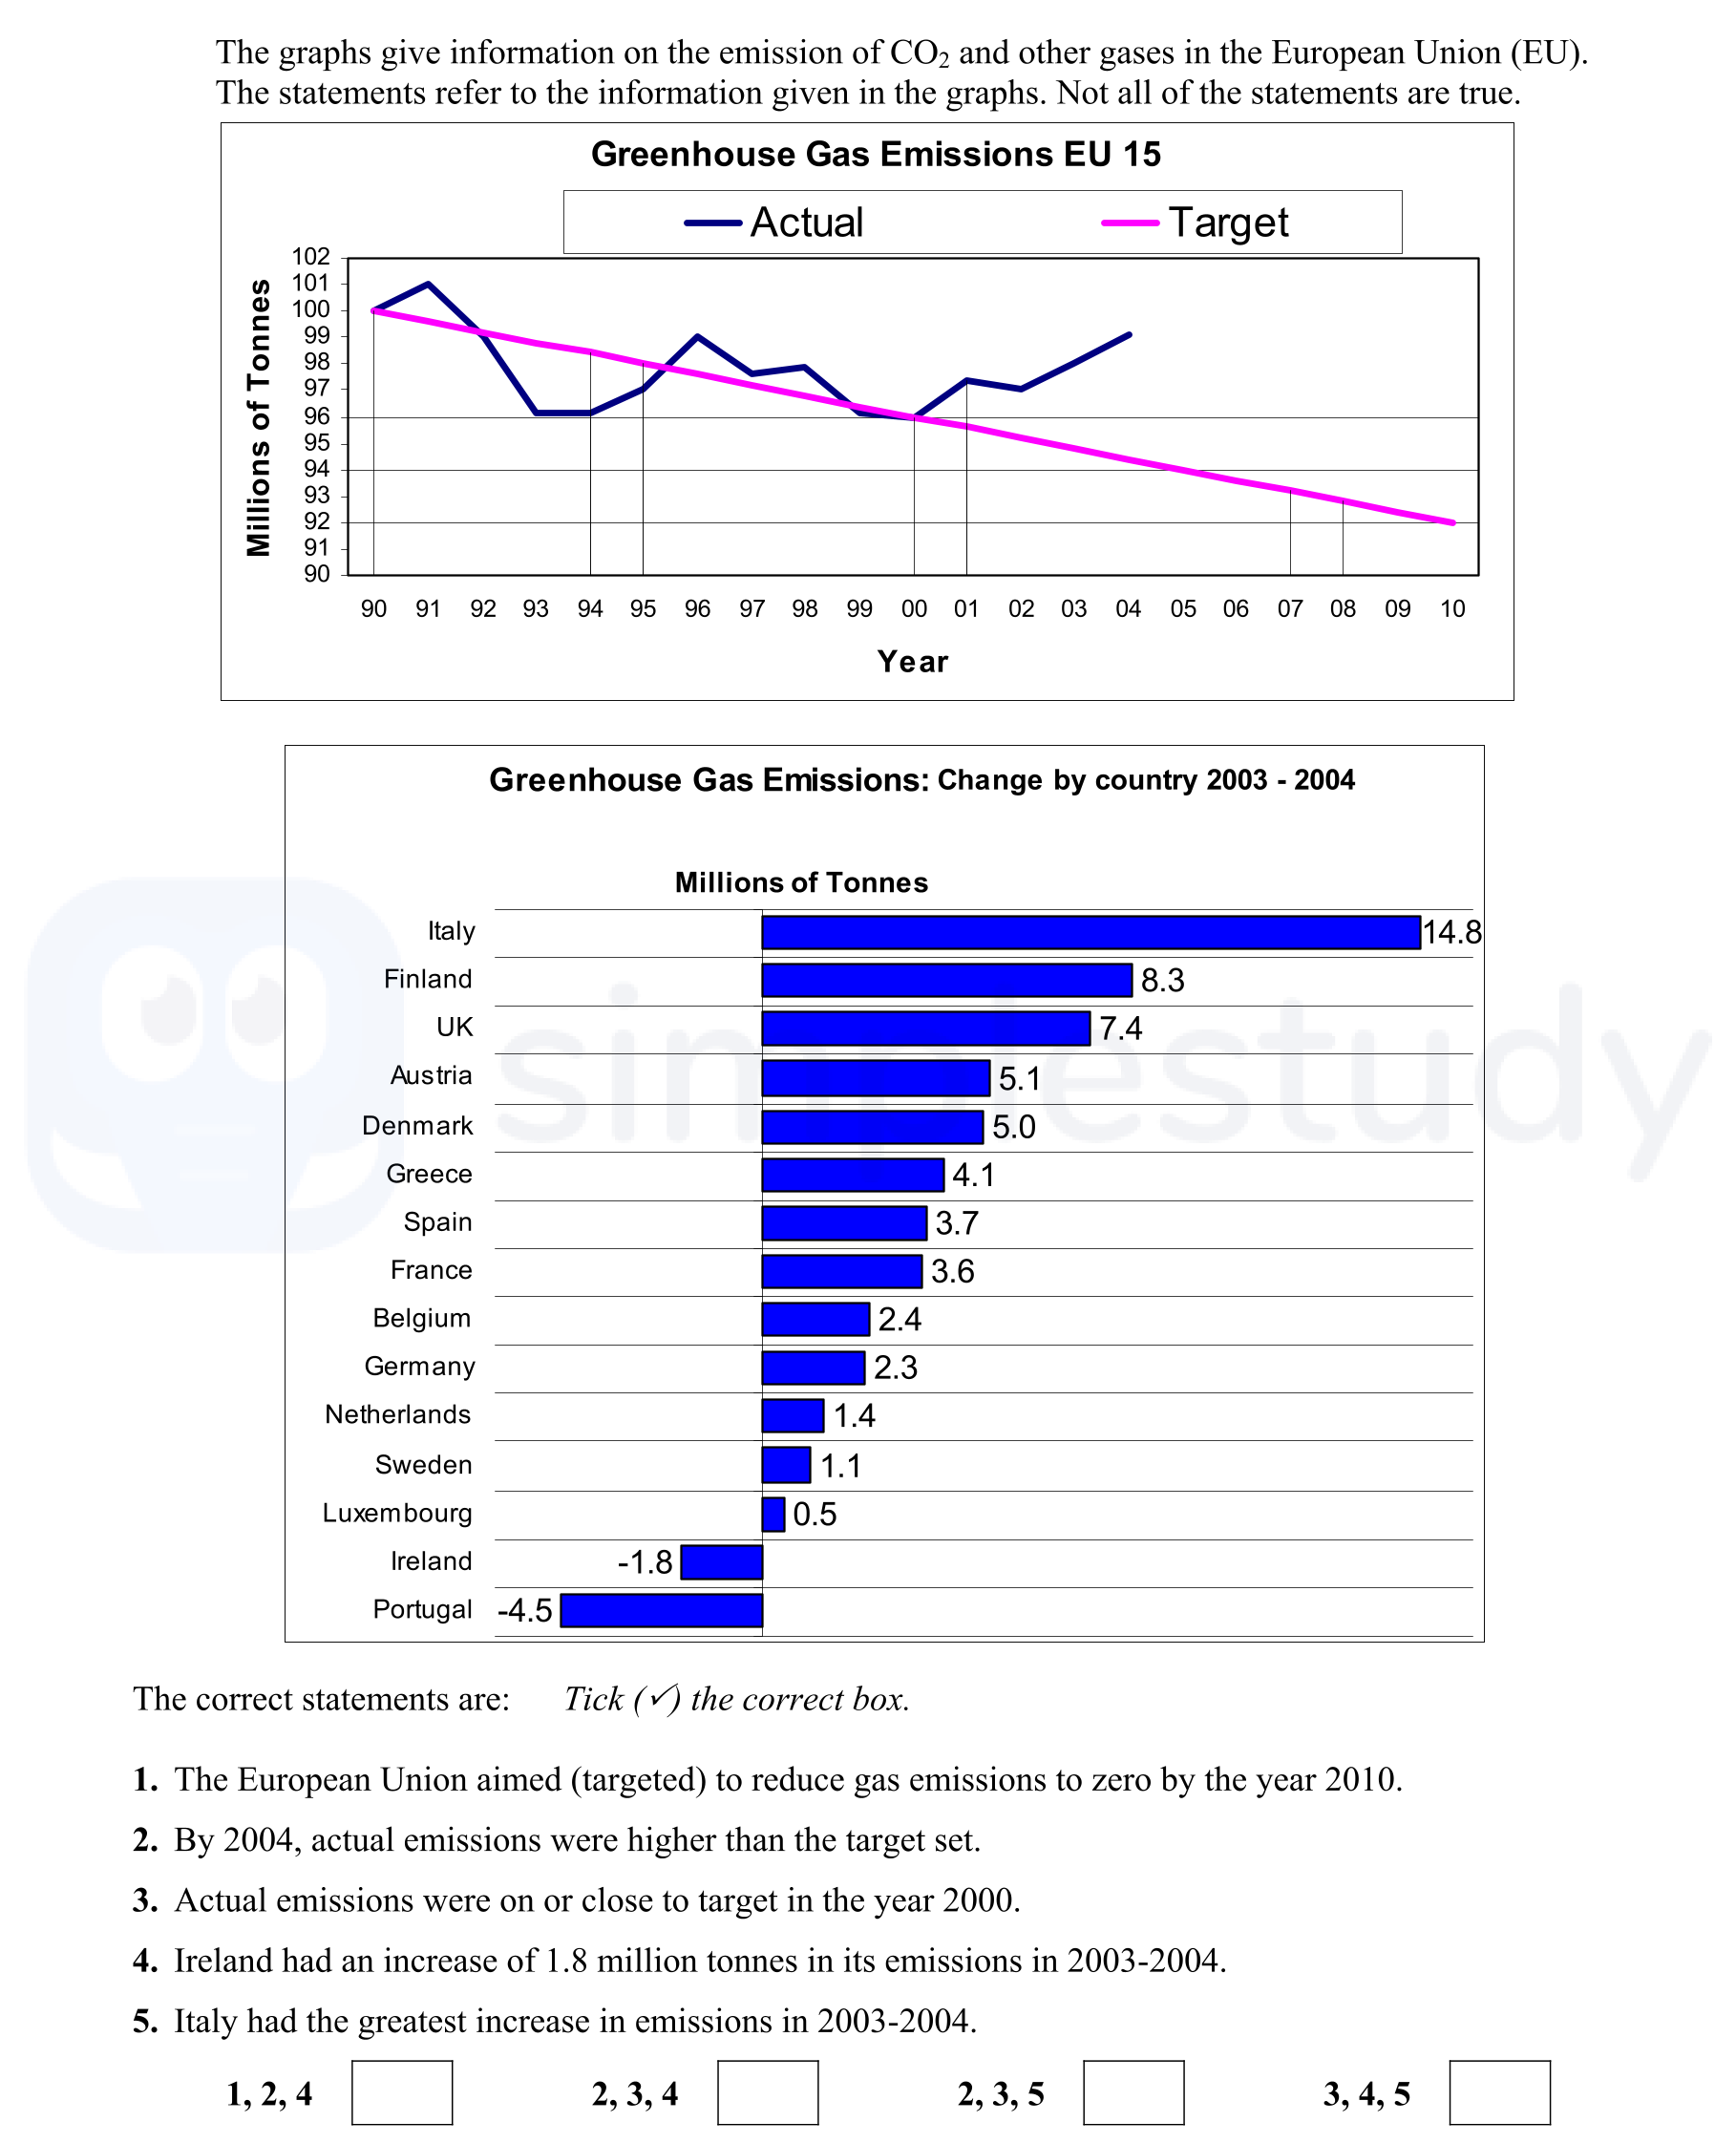
The graphs give information on the emission of CO₂ and other gases in the European Union (EU). The statements refer to the information given in the graphs. Not all o... show full transcript
Worked Solution & Example Answer:The graphs give information on the emission of CO₂ and other gases in the European Union (EU) - Junior Cycle Geography - Question 1 - 2007
Step 1
1. The European Union aimed (targeted) to reduce gas emissions to zero by the year 2010.
96%
114 rated
Only available for registered users.
Sign up now to view full answer, or log in if you already have an account!
Answer
This statement is true, as the EU set ambitious targets for reducing greenhouse gas emissions to combat climate change.
Step 2
2. By 2004, actual emissions were higher than the target set.
99%
104 rated
Only available for registered users.
Sign up now to view full answer, or log in if you already have an account!
Answer
This statement is accurate, as indicated by the graph, which shows actual emissions surpassing the target emissions in that year.
Step 3
3. Actual emissions were on or close to target in the year 2000.
96%
101 rated
Only available for registered users.
Sign up now to view full answer, or log in if you already have an account!
Answer
This statement is false. The graph indicates that emissions in 2000 were above the target set for that year.
Step 4
4. Ireland had an increase of 1.8 million tonnes in its emissions in 2003-2004.
98%
120 rated
Only available for registered users.
Sign up now to view full answer, or log in if you already have an account!
Answer
This statement is true as Ireland's emissions indeed increased by this amount during the specified period.
Step 5
5. Italy had the greatest increase in emissions in 2003-2004.
97%
117 rated
Only available for registered users.
Sign up now to view full answer, or log in if you already have an account!
Answer
This statement is true according to the data; Italy exhibited the largest increase in emissions during that timeframe.
Join the Junior Cycle students using SimpleStudy...