Examine the annual temperature and precipitation graphs of Valentia, Co Kerry - Junior Cycle Geography - Question 6 - 2008
Question 6
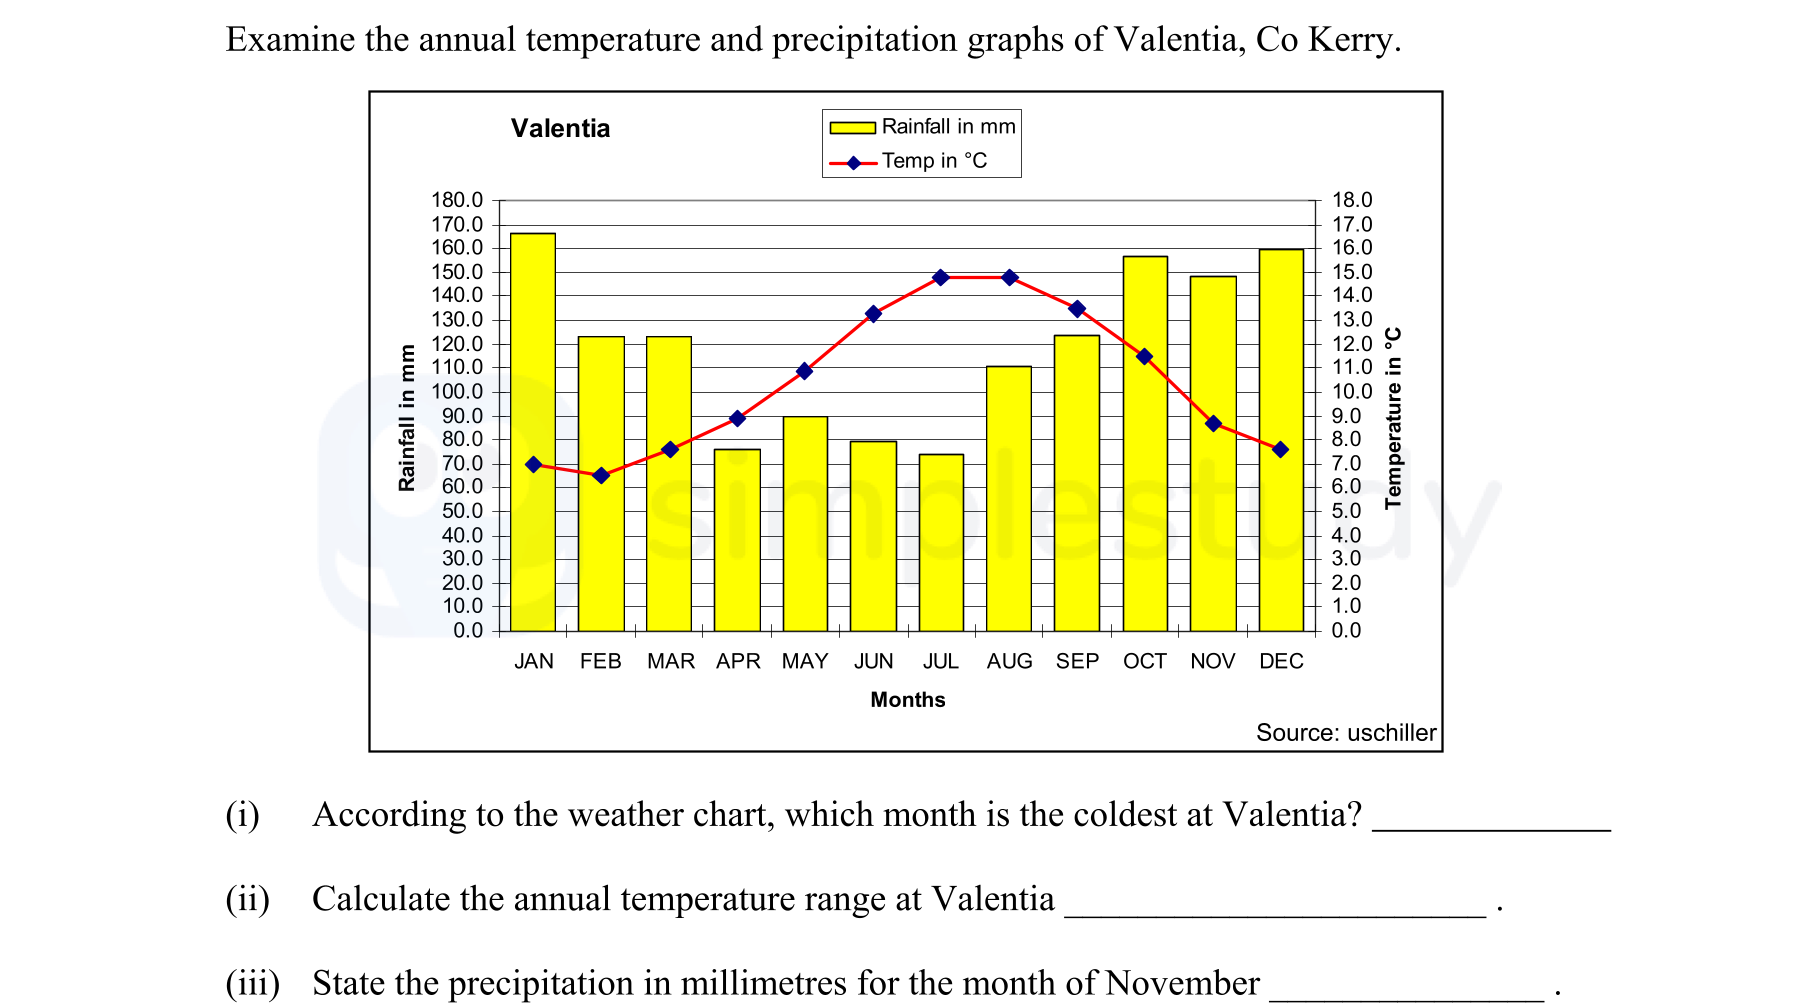
Examine the annual temperature and precipitation graphs of Valentia, Co Kerry.
(i) According to the weather chart, which month is the coldest at Valentia?
(ii) Ca... show full transcript
Worked Solution & Example Answer:Examine the annual temperature and precipitation graphs of Valentia, Co Kerry - Junior Cycle Geography - Question 6 - 2008
Step 1
According to the weather chart, which month is the coldest at Valentia?
96%
114 rated
Only available for registered users.
Sign up now to view full answer, or log in if you already have an account!
Answer
The coldest month at Valentia is February.
Step 2
Calculate the annual temperature range at Valentia.
99%
104 rated
Only available for registered users.
Sign up now to view full answer, or log in if you already have an account!
Answer
The annual temperature range at Valentia is calculated as follows:
Maximum temperature: 8.5 °C
Minimum temperature: 0 °C
Thus, the annual temperature range = Maximum - Minimum = 8.5°C−0°C=8.5°C.
Step 3
State the precipitation in millimetres for the month of November.
96%
101 rated
Only available for registered users.
Sign up now to view full answer, or log in if you already have an account!
Answer
The precipitation in millimetres for the month of November is approximately 150 mm.
Join the Junior Cycle students using SimpleStudy...