Solving Inequalities (Junior Cert Mathematics): Revision Notes
Solving Inequalities
Inequalities are mathematical expressions that show the relationship between two values where one is greater than, less than, greater than or equal to, or less than or equal to the other. Unlike equations, which state that two expressions are equal, inequalities tell us that one side is either larger or smaller than the other.
Here are the common inequality symbols:
-
means "greater than."
-
means "less than."
-
means "greater than or equal to."
-
means "less than or equal to." For example:
-
means is greater than .
-
means is less than or equal to .
How Do We Solve Inequalities?
Solving inequalities is very similar to solving regular equations, but with one key difference: if you multiply or divide both sides of the inequality by a negative number, you must reverse the direction of the inequality sign.
Let's go through the process step by step with an example.
Example: Solving an Inequality
Let's solve the inequality:
Step 1: Isolate the variable term
First, we want to get all the terms involving on one side of the inequality and the constant terms on the other side. We'll start by subtracting 3 from both sides:
Simplifying the right side:
Step 2: Solve for the variable
Next, we want to solve for . Since means times , we need to divide both sides by to get by itself.
But remember, when we divide by a negative number, we must reverse the inequality sign:
Simplifying:
Solution: The solution is . This means that can be any number greater than .
Graphing Inequalities on a Number Line
After solving an inequality, it's often helpful to represent the solution on a number line. This visual representation makes it easier to see the range of values that satisfy the inequality.
How Do We Graph Inequalities?
To graph the solution of an inequality:
- Open circle or closed circle:
- Use an open circle if the inequality is strict (greater than or less than, or ).
- Use a closed circle if the inequality includes equal to or .
- Draw the arrow:
- Draw an arrow extending to the right if the inequality is greater than or ).
- Draw an arrow extending to the left if the inequality is less than or .
- Consider the Set:
- If the inequality solution is over (integers), the graph should only include integer points.
- If the solution is over (natural numbers), the graph should only include positive integers starting from .
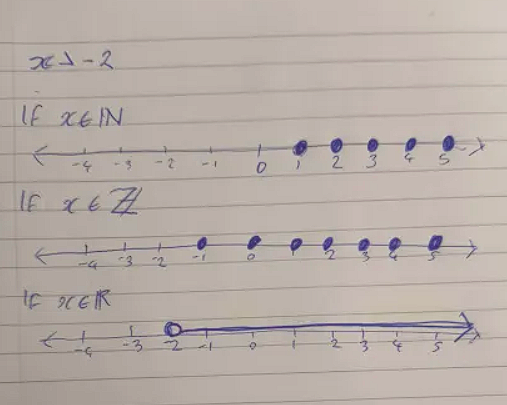
- If the solution is over (real numbers), the graph should include all real numbers, and the line should be continuous. Let's graph the solution to the inequality we just solved, .
Graphing Example:
For the inequality :
-
Open Circle: Since does not include itself, we use an open circle at .
-
Arrow to the Right: Because is greater than , the arrow will extend to the right from . For Different Sets:
-
If the solution is over , draw a continuous arrow to the right, showing all real numbers greater than .
-
If the solution is over , plot only the integer points greater than (i.e., ).
-
If the solution is over , plot only the positive integers starting from .
Summary
Solving Inequalities:
-
To solve inequalities, isolate the variable just as you would in an equation.
-
Remember, if you multiply or divide both sides by a negative number, reverse the inequality sign. Graphing Inequalities:
-
Use an open circle for strict inequalities or ).
-
Use a closed circle for inequalities that include equality ( or ).
-
Draw an arrow to the right for ( or ), and to the left for or .
-
Remember to adjust your graph depending on whether you're dealing with natural numbers , integers (), or real numbers (). Understanding how to solve and graph inequalities helps in visualising solutions and understanding the range of possible values that satisfy the inequality. With practice, these steps will become more intuitive and easier to apply!