Drawing Graphs (Junior Cert Mathematics): Revision Notes
Drawing Graphs
Graphing functions is a key skill in Junior Cycle Maths. It helps you visualise how functions behave by plotting their outputs on a coordinate plane. This topic is important because it connects algebra with geometry, allowing you to solve problems graphically.
Key Concepts:
- Function: A function is a rule that assigns each input exactly one output. We often write it as , where is the input.
- Domain: The set of possible inputs (values of ).
- Range: The set of possible outputs (values of ) ).
- Graph of a Function: The visual representation of the function on a coordinate plane. The - represents the inputs, and the -represents the outputs.
Steps to Graph a Function:
- Choose the Domain: Decide the range of -values you will use (e.g., to ).
- Create a Table of Values:
- Substitute each value into the function to find the corresponding (or ) value.
- Write these pairs of values in a table.
- Plot the Points: Mark each pair on the graph.
- Draw the Graph: Connect the points with a smooth curve or straight line, depending on the function.
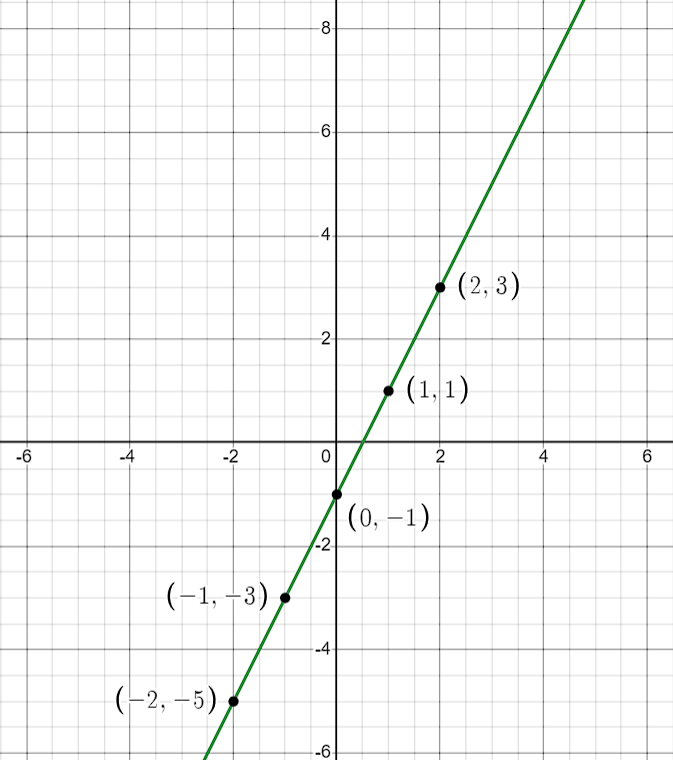
Example 1: Graphing a Linear Function Let's graph the function .
Step 1: Choose the Domain
We'll use the values .
Step 2: Create a Table of Values
Step 3: Plot the Points
On graph paper, plot the points and .
Step 4: Draw the Graph
Draw a straight line through the points. This is the graph of the function . This is shown below:
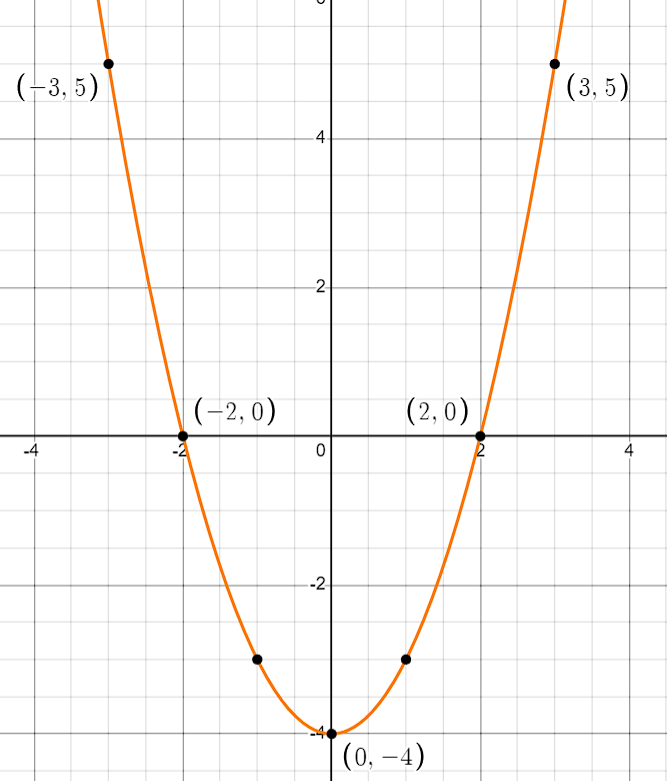
Example 2: Graphing a Quadratic Function Now, let's graph the function.
Step 1: Choose the Domain
We'll use the values .
Step 2: Create a Table of Values
| 0 | ||
Step 3: Plot the Points
Plot the points , and .
Step 4: Draw the Graph
Draw a smooth curve through the points. This U-shaped curve is the graph of the quadratic function .
Exam Tips:
- Use a ruler: Ensure your graphs are neat and accurate, especially for linear functions.
- Check your work: Double-check your calculations for the table of values.
- Understand the shape: Recognise that linear functions produce straight lines, quadratic functions produce U-shaped curves, and so on.
- Label the Axes: Always label your - and - and provide a title if required.