Quadratic: y=ax^2 +bx + c (Junior Cert Mathematics): Revision Notes
Quadratic Functions
What is a Quadratic Function?
A quadratic function is a function that includes an ( squared). This is different from a straight line because the makes the graph curve into a U-shape. This U-shaped curve is called a parabola.
The simplest quadratic function is:
This means that for any value of , you square it to get the value of . For example, if , then .
Why Do Quadratic Functions Create Parabolas?
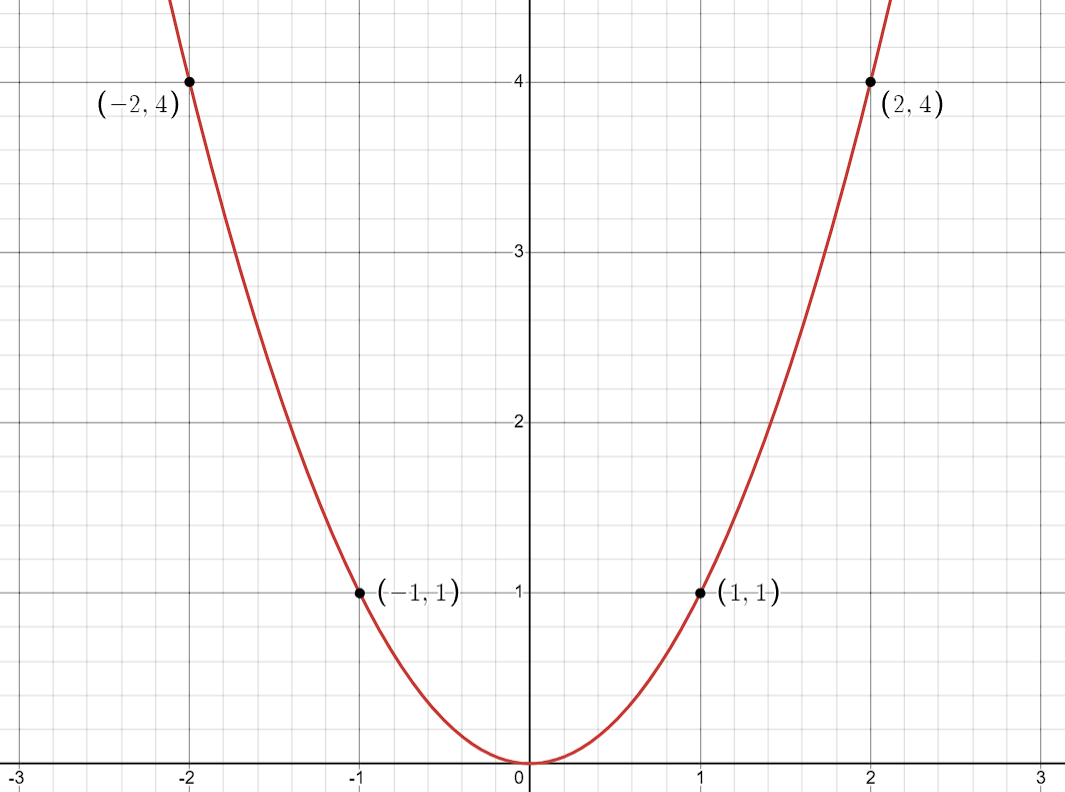
When you plot the points for a quadratic function like on a graph, you'll notice that the graph doesn't form a straight line like with linear functions. Instead, it forms a curve called a parabola. This happens because the term causes the values of to increase more rapidly as gets larger.
A parabola is a symmetrical curve, which means it looks the same on both sides of a vertical line called the axis of symmetry. The lowest point on a parabola that opens upwards is called the vertex.
Discovering the Parabola: Plotting
Let's explore how this works by looking at the function . We'll start by calculating the outputs f(x)$$-values for some inputs (x$$-values):
Now, let's plot these points on a graph:
- Plot the Points: Each pair of and values gives you a point on the graph. For example, when , , so you plot the point .
- Draw the Curve: Once you've plotted all the points, connect them with a smooth curve. You should see that the curve is -shaped and symmetrical. This is your parabola.
- Notice the Symmetry: The graph is symmetrical around the y$$-axis, which is the axis of symmetry in this case.
Graphing Functions When the Coefficient of Is Negative
If the coefficient of is negative in a quadratic function, e.g., , then the graph of the function will take the shape of an upside-down parabola as shown below:
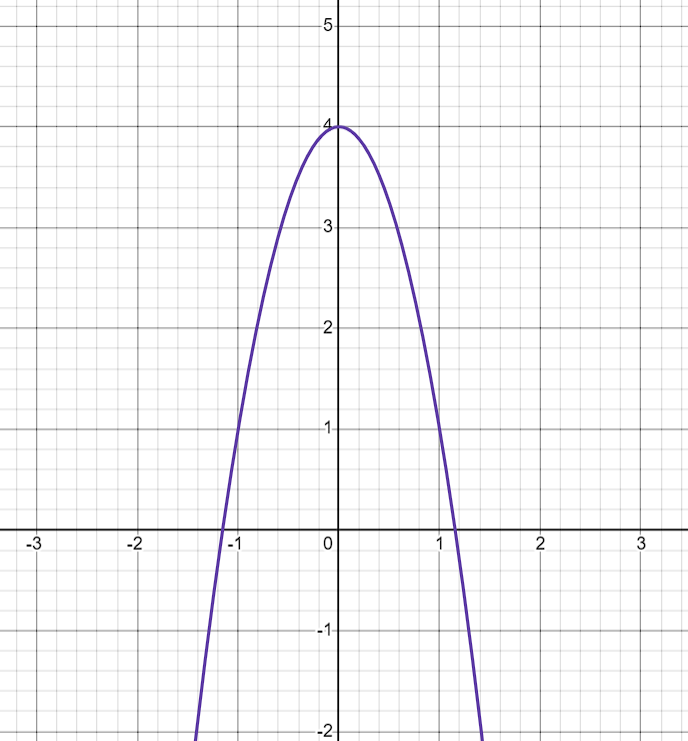
Exam Tip: If the graph looks like a happy face (opening upwards), the coefficient of is positive. If it looks like a sad face (opening downwards), the coefficient of is negative.
Using the Table Function on a Calculator
- Find the table button – it might say
TABLEor be written above another key (you may need to pressSHIFTor2ndfirst). - Enter your equation – type it in exactly as you see it, e.g.
2x + 3. - Set the starting value – choose the first
xvalue the table should show (e.g. start at 0). - Set the step value – choose how much
xchanges each time (e.g. step of 1 meansxgoes 0, 1, 2, 3…). - View the table – the calculator will list
xvalues in one column and the matchingy(answer) values in another. - Scroll up or down – use arrow keys to see more values.
- Change settings if you need different starting points or steps.
- Use it to spot patterns – the table can help you see how
ychanges asxchanges.
Summary
- A quadratic function is a function that includes .
- The graph of a quadratic function forms a U-shaped curve called a parabola.
- If the term is negative, then the parabola will be an upside down U-shape.
- The simplest quadratic function is .
- You can discover the shape of the parabola by plotting points on a graph.