Weather Maps (Leaving Cert Geography): Revision Notes
📚 Revision Notes
Weather Maps
Key Features of Weather Maps
Isobars
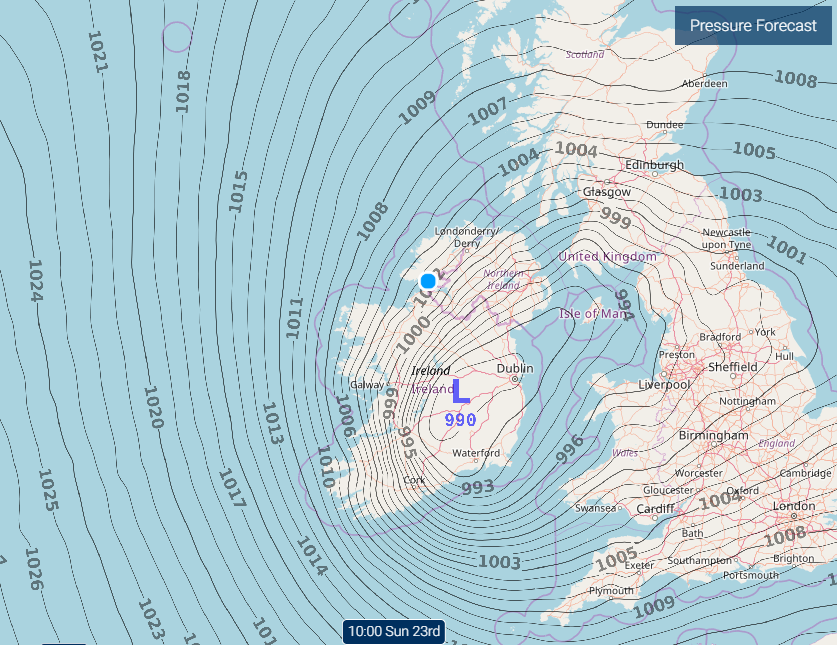
- Definition: Lines connecting points of equal atmospheric pressure, measured in millibars (mb).
- Interpretation:
- Close Isobars: Indicate strong winds.
- Wide-Spaced Isobars: Indicate light winds.
Weather Symbols
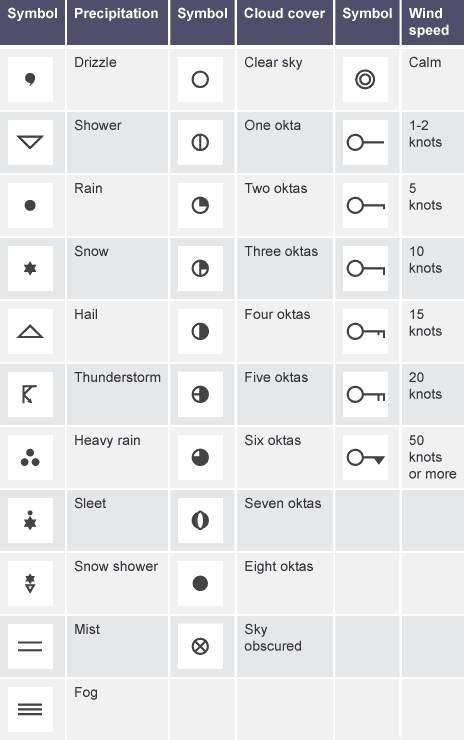
Symbols represent different weather conditions, such as:
- Cloud cover: Shaded circles for varying degrees of cloudiness.
- Precipitation: Symbols for rain, snow, hail, or thunderstorms.
- Wind direction and speed: Arrowed lines (wind barbs) showing direction (from where the wind blows) and speed (short/long lines for strength).
Pressure Systems
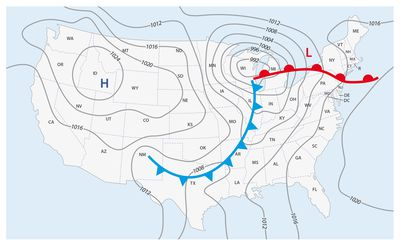
- High Pressure (Anticyclone):
- Represented by H.
- Brings calm, settled weather with clear skies.
- Low Pressure (Depression):
- Represented by L.
- Associated with unsettled weather, clouds, and precipitation.
Fronts
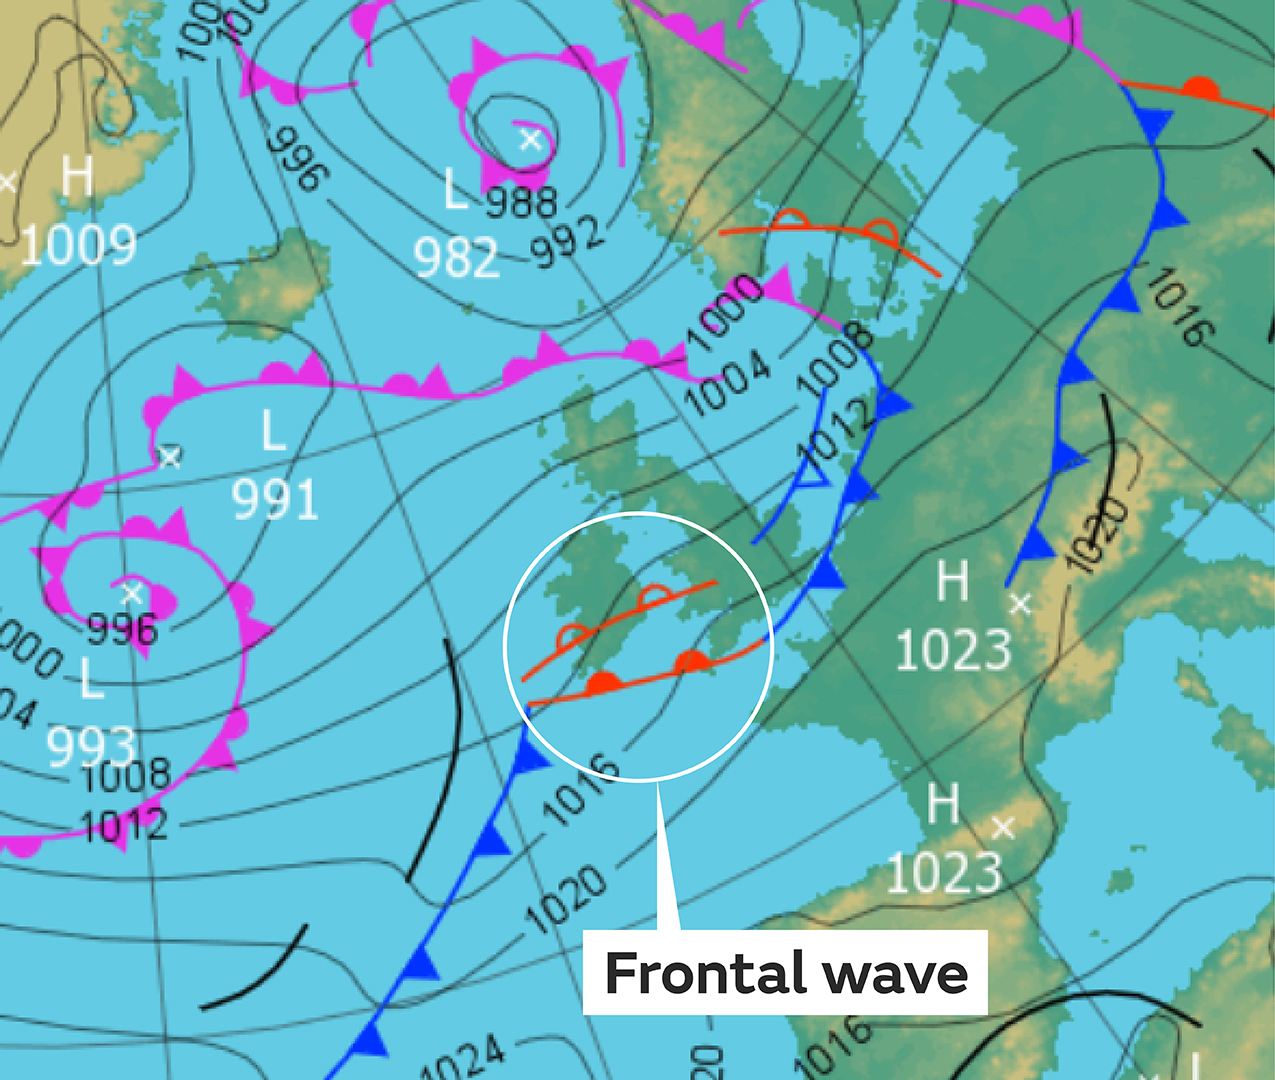
Indicate boundaries between air masses:
- Cold Front: Blue line with triangles, showing cold air pushing warm air.
- Warm Front: Red line with semicircles, showing warm air pushing cold air.
- Occluded Front: Purple line with alternating triangles and semicircles, indicating a mix of cold and warm air.
Temperature
Represented using isotherms (lines connecting points of equal temperature).
Using Weather Maps in Geography
Interpreting Weather Patterns
Analyse the movement of pressure systems and fronts to describe weather conditions in specific regions.
Predicting Weather
Use the direction of isobars and fronts to estimate future weather conditions.
Relating to Physical Geography
Examine how weather systems interact with landforms, such as mountains influencing rainfall (relief rainfall).
Tips for Success
- Familiarise yourself with all weather map symbols and their meanings.
- Pay attention to the direction of pressure systems and fronts when analysing maps.
- Practice interpreting past exam weather maps to build confidence.