Graphing Functions (Leaving Cert Mathematics): Model Answers
Quadratic Functions and Profit Optimization Modelling
Sample Answer
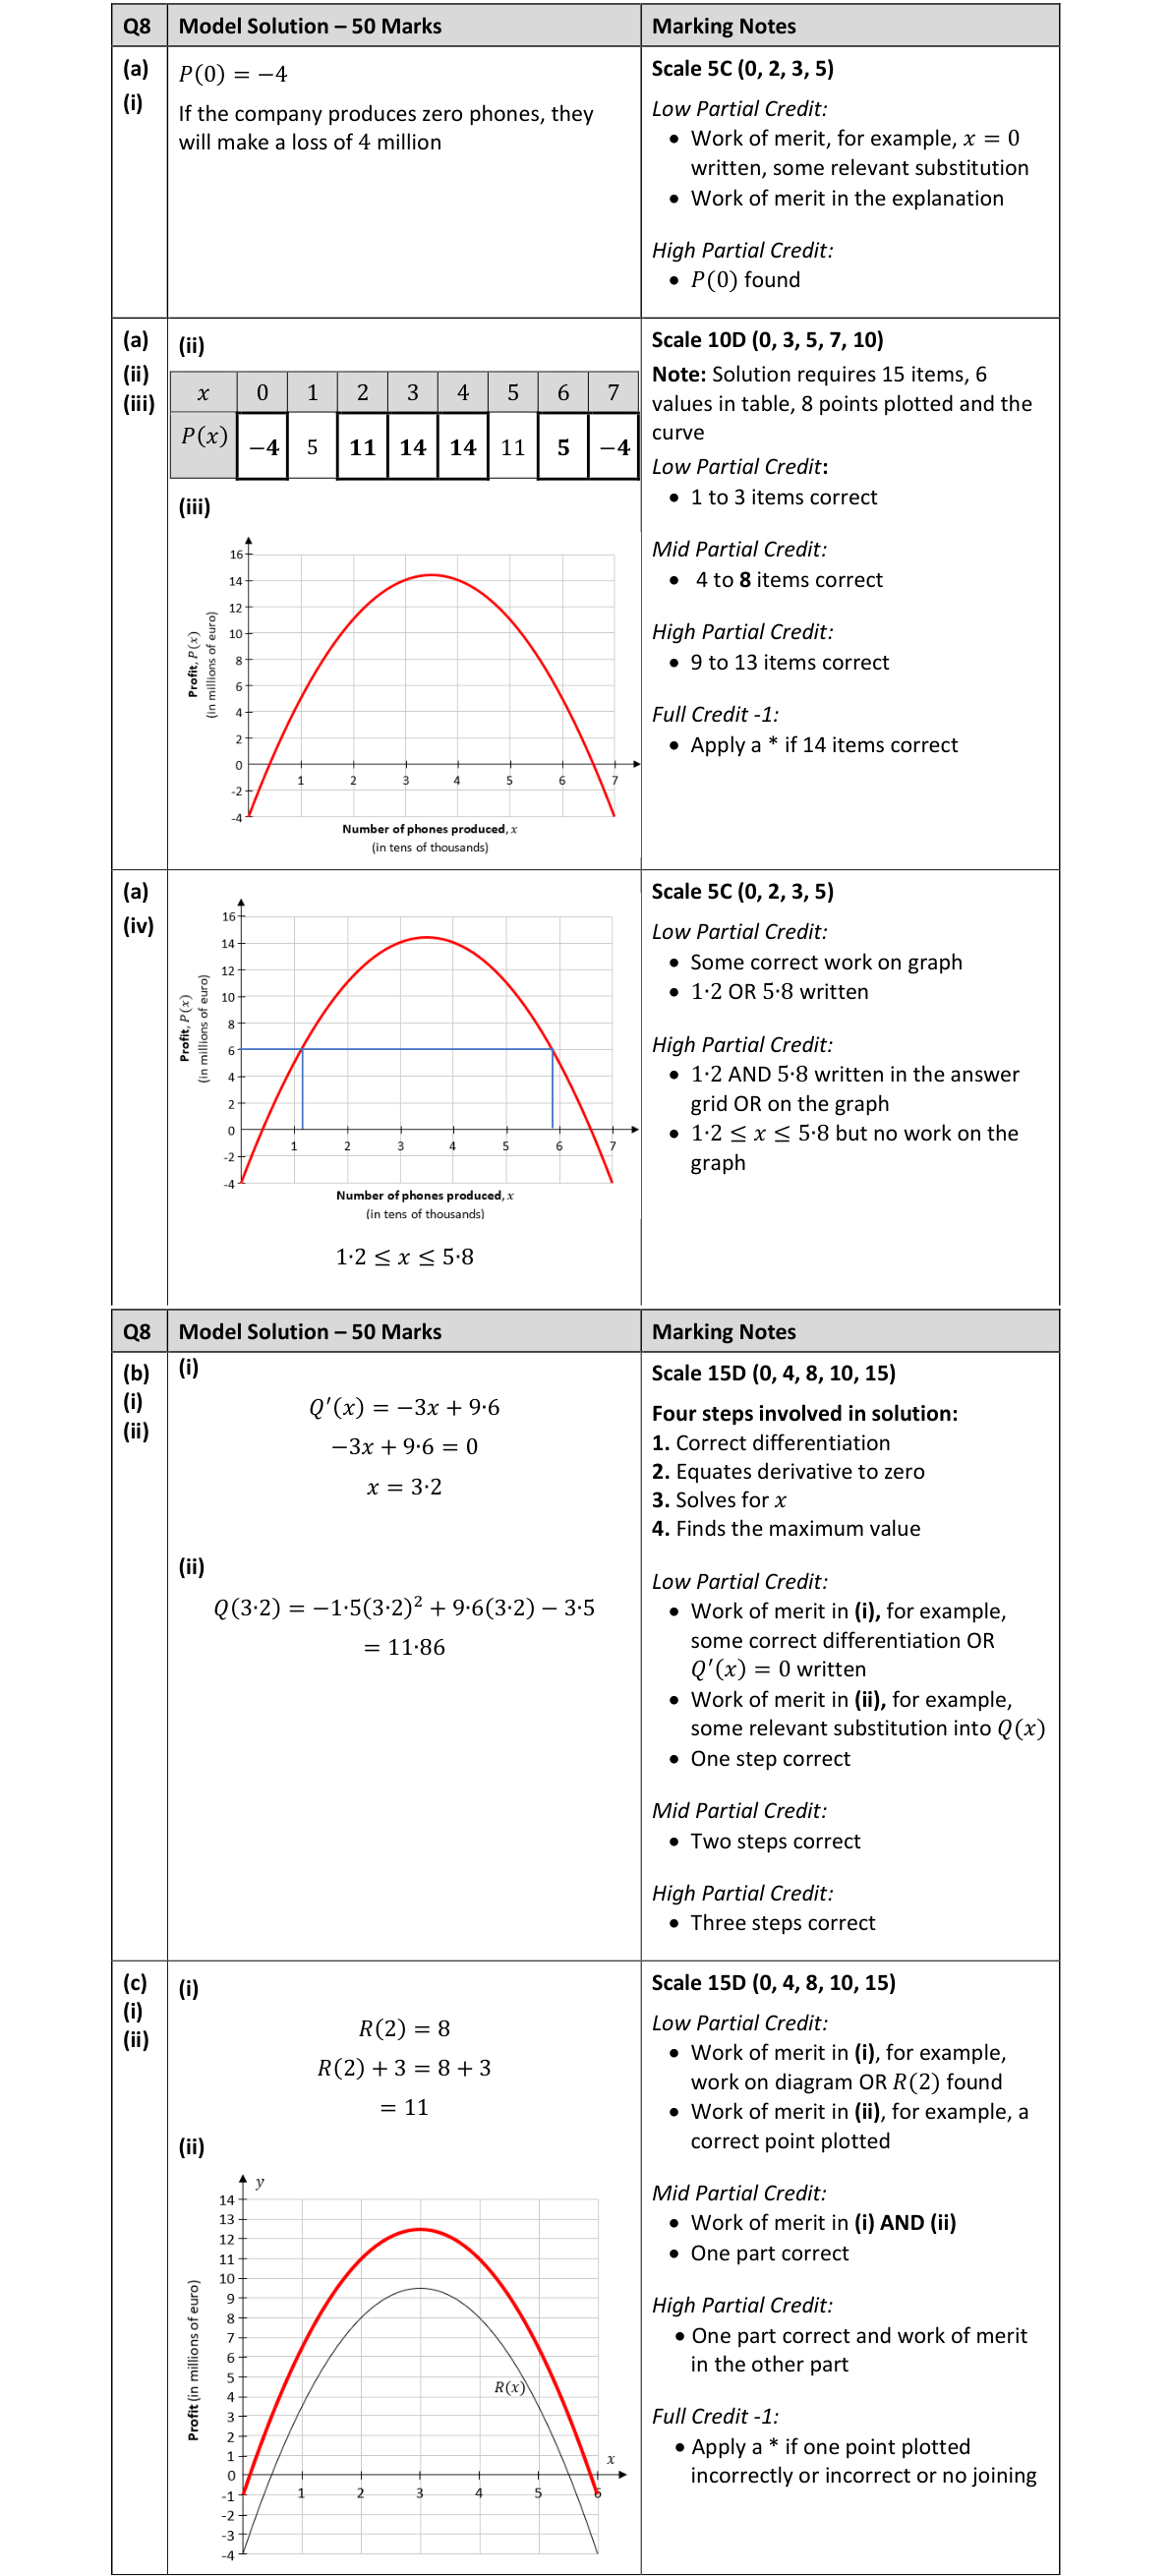
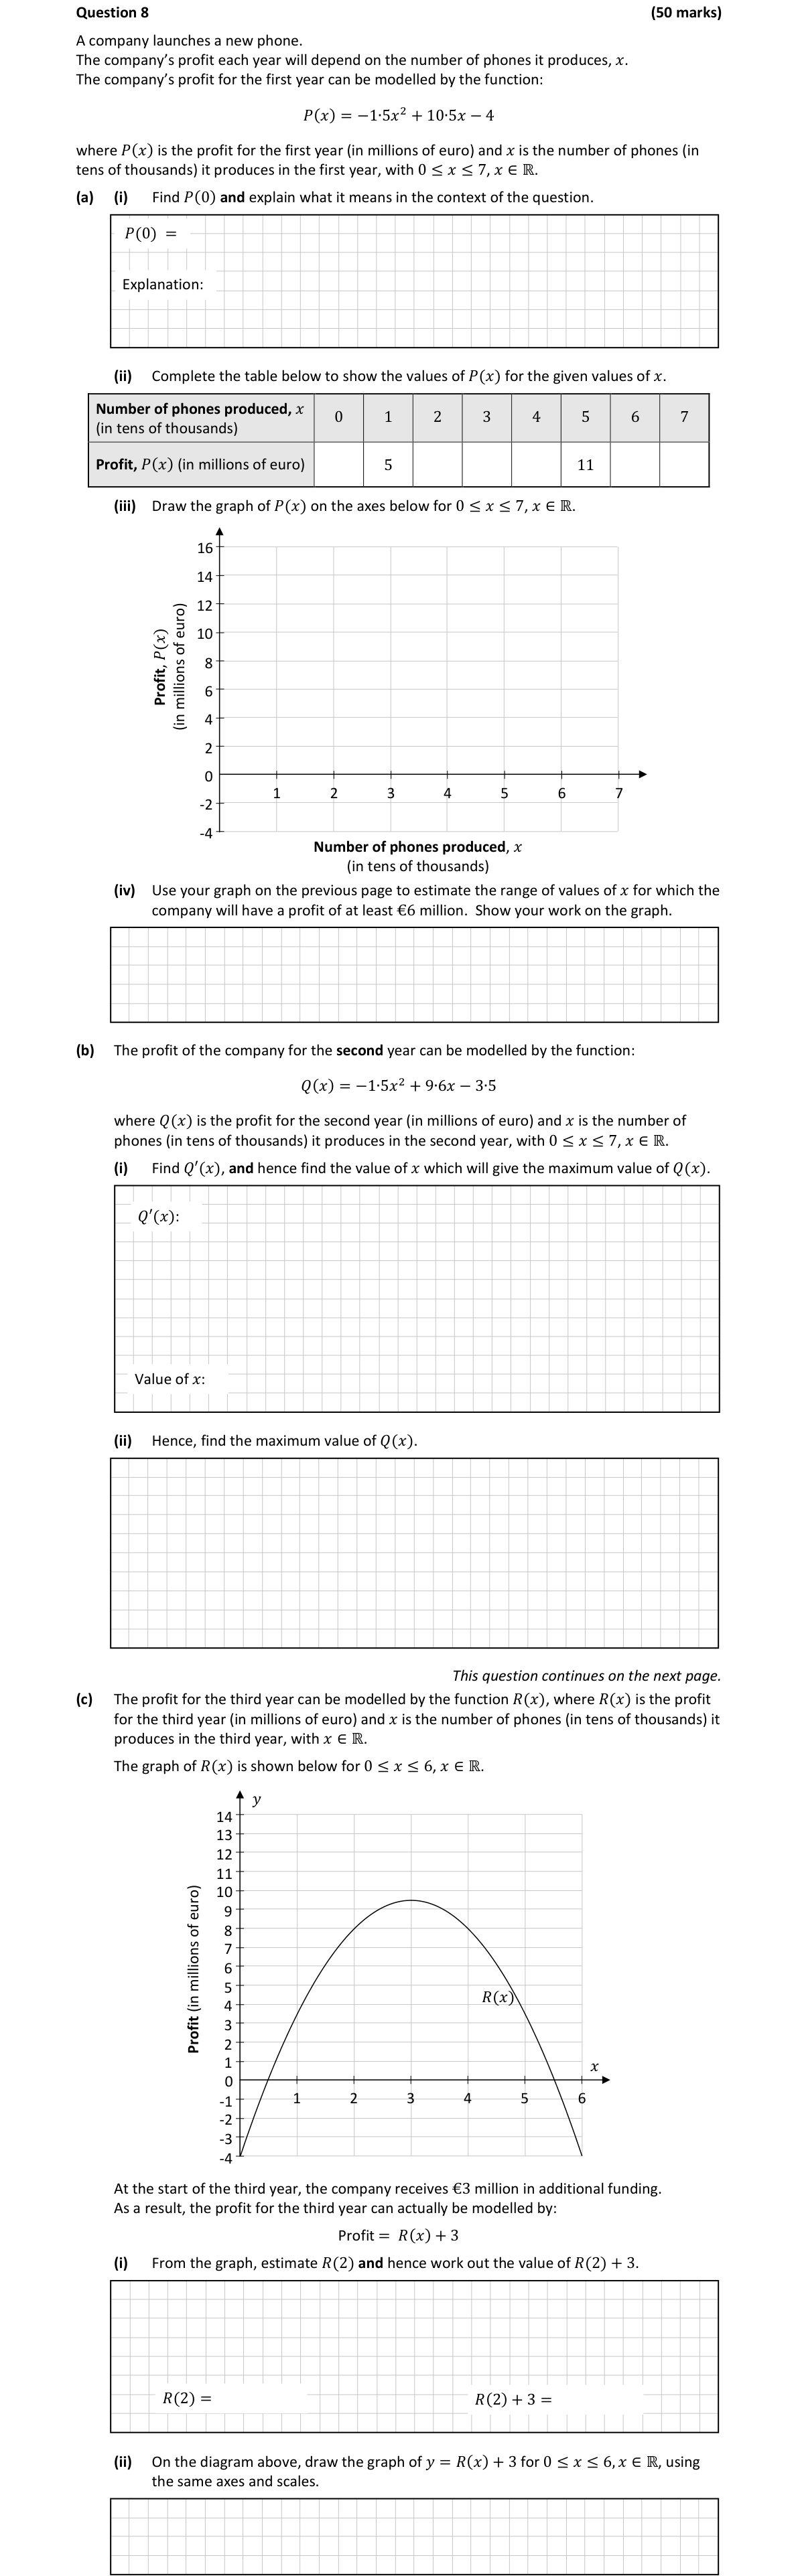
Part (a)(i) - Finding P(0) and its meaning
Working
To find , substitute into the profit function:
Explanation
means that if the company produces zero phones in the first year, they will make a loss of €4 million. This represents the initial costs or overheads (such as setup costs, facilities, equipment) that the company incurs even before producing any phones.
5/5 Marks
- Correct substitution of : 2 marks
- Correct calculation showing : 2 marks
- Clear explanation in context: 1 mark
Part (a)(ii) - Completing the profit table
Working
Calculate for each value of from 0 to 7:
For :
For :
For :
For :
For :
For :
For :
For :
Completed Table
| Number of phones produced, (in tens of thousands) | 0 | 1 | 2 | 3 | 4 | 5 | 6 | 7 |
|---|---|---|---|---|---|---|---|---|
| Profit, P(x) (in millions of euro) | -4 | 5 | 11 | 14 | 14 | 11 | 5 | -4 |
Part (a)(iii) - Drawing the graph of P(x)
Description of Graph
Students should plot the following points from the completed table and draw a smooth parabola through them:
Points to plot:
Key features:
- The graph is a downward-opening parabola (negative coefficient of )
- Maximum point occurs between and at approximately
- The curve is symmetrical about the line
- The parabola crosses the x-axis between and , and again between and
- All points should be accurately plotted and joined with a smooth curve (not straight line segments)
Parts (ii) and (iii) Combined: 10/10 Marks This question requires 15 items total:
- 6 correct values in the table (already 2 were given): 6 marks
- 6 points plotted correctly on the graph: 6 marks
- Smooth parabolic curve drawn: 3 marks
Mark allocation:
- 1-3 items correct: Low Partial Credit (3 marks)
- 4-8 items correct: Mid Partial Credit (5-7 marks)
- 9-13 items correct: High Partial Credit (7 marks)
- 14 items correct: Full Credit -1 (9 marks)
- All 15 items correct: Full Credit (10 marks)
Part (a)(iv) - Estimating range of x for profit ≥ €6 million
Working
From the graph, we need to find the range of values where .
Method:
- Draw a horizontal line at on the graph
- Find where this line intersects the parabola
- The x-coordinates of these intersection points give the range
From the graph:
- The line intersects the parabola at two points
- First intersection: approximately (between where and where )
- Second intersection: approximately (between where and where )
Students should show work on the graph by:
- Drawing a horizontal line at
- Marking the intersection points
- Reading off the x-values
Final Answer
The company will have a profit of at least €6 million when:
This means the company needs to produce between 12,000 and 58,000 phones (since is in tens of thousands).
5/5 Marks
- Evidence of work on the graph (horizontal line at ): 2 marks
- Both values and identified: 2 marks
- Correct inequality format: 1 mark
Part (b)(i) - Finding Q'(x) and the value of x for maximum profit
Working
Step 1: Differentiate Q(x)
Given:
Using the power rule:
Step 2: Set the derivative equal to zero
For maximum or minimum values, :
Step 3: Solve for x
Step 4: Verify this is a maximum
Since the coefficient of in is negative (), the parabola opens downward, so gives a maximum value.
Final Answer
Value of x for maximum profit: (which represents 32,000 phones)
Part (b)(ii) - Finding the maximum value of Q(x)
Working
Substitute into :
Calculate :
Substitute:
Final Answer
Maximum profit in the second year: million euro
This means the company will achieve a maximum profit of €11.86 million when they produce 32,000 phones in the second year.
Parts (i) and (ii) Combined: 15/15 Marks
Four key steps are required:
- Correct differentiation (): 4 marks
- Setting derivative to zero (): 4 marks
- Solving for (): 4 marks
- Finding maximum value (): 3 marks
Mark allocation:
- Low Partial Credit (4 marks): Some correct differentiation OR written
- Mid Partial Credit (8 marks): Two steps correct
- High Partial Credit (10 marks): Three steps correct
- Full Credit (15 marks): All four steps correct
Part (c)(i) - Estimating R(2) and calculating R(2) + 3
Working
From the graph provided:
Looking at the graph of at :
- Locate on the horizontal axis
- Draw a vertical line up to the curve
- Read the corresponding y-value
Estimate: (the curve passes through approximately )
Calculate R(2) + 3:
Final Answer
From the graph: (million euro)
Therefore: (million euro)
This value of 11 represents the actual profit for the third year after receiving the €3 million additional funding.
Part (c)(ii) - Drawing the graph of y = R(x) + 3
Description of Graph
The graph of is a vertical translation of the graph of upward by 3 units.
Key features to include:
- Same shape as R(x): The new curve has identical shape to the original parabola - same width, same curvature
- Vertical shift: Every point on is moved 3 units upward:
- If a point is on , then is on
- Key points to plot:
- Original , so new point:
- Original , so new point: ✓ (matches our calculation)
- Original maximum at approximately , so new maximum:
- Original , so new point:
- Same x-axis crossings shifted: The parabola no longer crosses the x-axis since all y-values are increased by 3
- Use the same axes and scales as provided in the question
Drawing instructions:
- Draw a smooth parabola
- Ensure it's the same shape as but positioned 3 units higher
- The curve should pass through as calculated in part (i)
- Label the curve as
- Ensure smooth joining of all points (no sharp corners)
Parts (i) and (ii) Combined: 15/15 Marks
Mark allocation:
- Low Partial Credit (4 marks): Work of merit in (i) - diagram work shown OR found; OR work of merit in (ii) - a correct point plotted
- Mid Partial Credit (8 marks): Work in BOTH (i) AND (ii) with one part correct
- High Partial Credit (10 marks): One part fully correct with work of merit in the other part
- Full Credit -1 (14 marks): One point plotted incorrectly or no smooth joining
- Full Credit (15 marks): Both parts fully correct with accurate graph
Requirements for full marks:
- Correct reading from graph: (2 marks)
- Correct calculation: (2 marks)
- Accurate graph of with correct vertical translation (8 marks)
- Smooth curve through all points (3 marks)
Total Marks: 50/50
Key Concepts Demonstrated:
- Quadratic functions: Understanding profit modelling with parabolic functions
- Function evaluation: Substituting values and interpreting results in context
- Graphing skills: Plotting points accurately and drawing smooth curves
- Differentiation: Finding maximum values using calculus
- Transformations: Understanding vertical translations of functions
Common Mistakes to Avoid:
- Forgetting to include units (millions of euro, tens of thousands)
- Not showing working steps clearly
- Drawing graphs with straight line segments instead of smooth curves
- Forgetting to set when finding maximum values
- Misreading scales on graphs
Marking Scheme