Graphical Representation of the Slope Function (Leaving Cert Mathematics): Revision Notes
Graphical Representation of the Slope Function
What is a slope function?
The slope function (also called the derivative function) tells us the steepness or gradient of a curve at every point along that curve. When we have a function , its slope function is written as or .
The slope function is incredibly useful because it gives us a complete picture of how the original function behaves - whether it's increasing, decreasing, or staying flat at any given point.
Key relationship between function and slope function
Understanding the connection between a function and its slope function is essential for calculus success. Here are the fundamental relationships you need to know:
When the original function is increasing (going upward as we move from left to right):
- The slope is positive
- The slope function has positive values
When the original function is decreasing (going downward as we move from left to right):
- The slope is negative
- The slope function has negative values
At turning points (local maxima or minima):
- The slope is zero
- The slope function equals zero at these points
This fundamental relationship means we can look at a slope function graph and immediately understand the behaviour of the original function.
Linear functions and their slope functions
Linear functions have the simplest slope functions because their gradient is constant everywhere.
Worked Example: Linear Function
Consider the linear function .
The slope of this line is constant at every point and equals 3.
Therefore, the slope function is simply .
This appears as a horizontal line at on the graph.
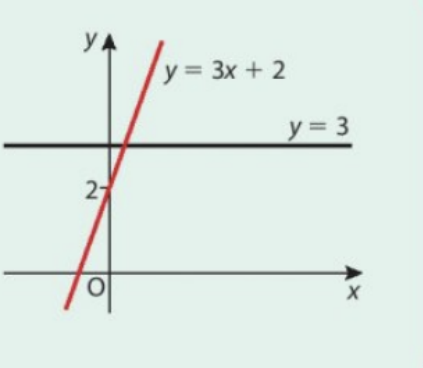
Key insight: For any linear function , the slope function is just the constant value .
Quadratic functions and their slope functions
Quadratic functions produce linear slope functions, creating interesting relationships between the curves.
Understanding quadratic slope functions:
- The original quadratic function is a parabola (curved)
- Its slope function is a straight line
- The slope changes continuously along the parabola
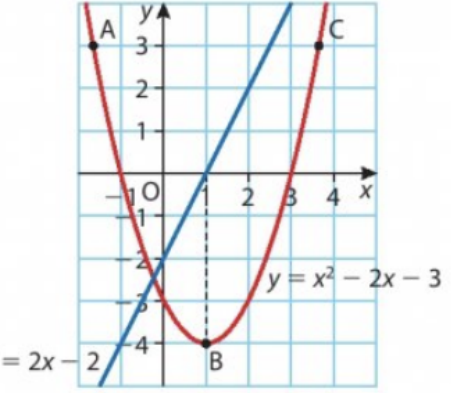
Worked Example: Quadratic Function
For the quadratic function :
- The slope function is (a straight line)
- At the vertex of the parabola (turning point), the slope equals zero
- This occurs when , so
Key observations for quadratic functions:
- Before the turning point: slope is negative, function decreasing
- At the turning point: slope is zero, function has minimum/maximum
- After the turning point: slope is positive, function increasing
Cubic functions and their slope functions
Cubic functions create quadratic slope functions, leading to more complex but predictable patterns.
Characteristics of cubic slope functions:
- Original cubic function has curves and potentially two turning points
- Slope function is quadratic (parabola-shaped)
- The slope function can be positive, negative, or zero at different intervals
Key patterns to remember:
- Where the cubic function is increasing: slope function is positive (above x-axis)
- Where the cubic function is decreasing: slope function is negative (below x-axis)
- At turning points of cubic function: slope function crosses the x-axis (equals zero)
Worked examples
Worked Example 1: Linear Function Slope Identification
Given:
Find: The slope function
Solution:
- The slope of is constant at 3
- Therefore:
- The slope function is the horizontal line
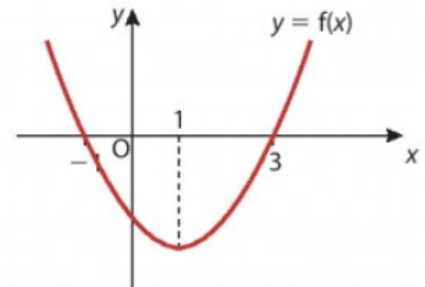
Worked Example 2: Quadratic Function Slope Identification
Given: A parabola opening upward with vertex at
Task: Identify which of three linear graphs represents its slope function
Solution: The correct slope function must satisfy:
- For : slope positive (parabola increasing)
- For : slope negative (parabola decreasing)
- At : slope zero (turning point)
This describes a line passing through with positive gradient.
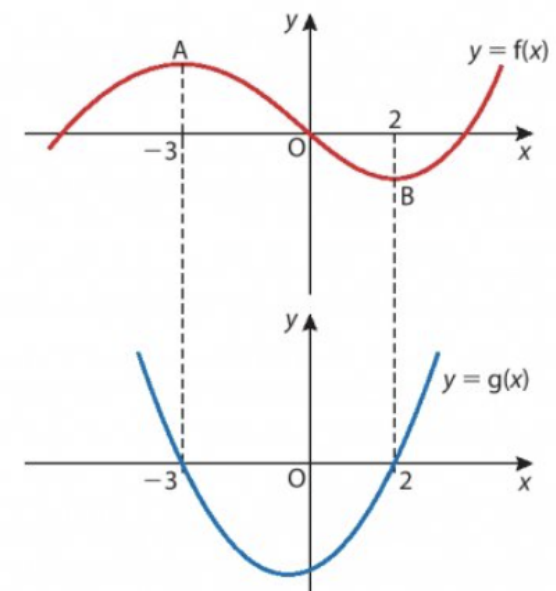
Worked Example 3: Cubic Function Slope Identification
Given: A cubic function with turning points
Task: Match the cubic with its quadratic slope function
Solution: The slope function must reflect:
- Positive values where the cubic increases
- Negative values where the cubic decreases
- Zero values at the cubic's turning points
The correct slope function is the parabola that matches these sign changes.
Exam tips and common traps
Essential exam strategies:
- Always check that slope function signs match the original function's increasing/decreasing behaviour
- Remember that turning points correspond to where the slope function equals zero
- Linear functions always have constant slope functions
- Quadratic functions always have linear slope functions
- Cubic functions always have quadratic slope functions
Common mistakes to avoid:
- Confusing positive/negative slopes with function behaviour
- Forgetting that slope equals zero at turning points
- Not checking that the slope function matches across all intervals
Key Points to Remember:
-
The slope function tells us the steepness at every point - positive slopes mean the function is increasing, negative slopes mean decreasing
-
At turning points, the slope is always zero - look for where the slope function crosses the x-axis to find turning points
-
Function type determines slope function type - linear gives constant, quadratic gives linear, cubic gives quadratic
-
Signs must match - when the original function goes up, the slope function must be positive; when it goes down, the slope function must be negative
-
Visual connection is key - practice linking the behaviour you see in the original function with what the slope function graph should look like