Graphics, Shapes, and Diagrams (Grade 10 NSC Matric Computer Application Technology): Revision Notes
Graphics, Shapes, and Diagrams
Graphics, shapes, and diagrams are powerful tools in word processing that help you create visually appealing and informative documents. These features allow you to enhance your written content with visual elements that can clarify information, draw attention to important points, and make your documents more professional and engaging.
In Microsoft Word, you'll find most of these tools under the Insert tab in the Illustrations group. This section includes options for inserting pictures, shapes, charts, SmartArt, and other visual elements that can transform a plain text document into something much more dynamic and effective.
Understanding how to use these visual tools effectively will help you create documents that not only look professional but also communicate your ideas more clearly to your readers.
Text boxes
Text boxes are special containers that allow you to place text anywhere in your document, independent of the normal text flow. They're particularly useful when you want to highlight important information, create callouts, or position text in specific locations on your page.
Creating text boxes
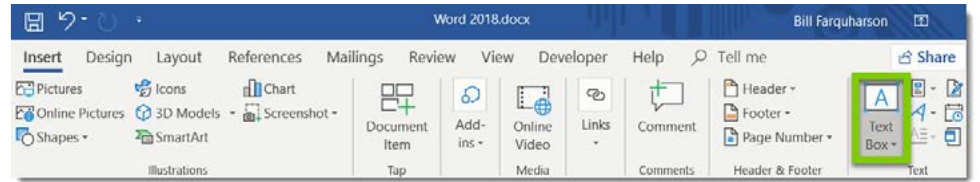
To insert a text box, you need to access the Insert tab and locate the Text Box command in the Text group. When you click on this option, Word provides several pre-designed text box styles, or you can choose to draw your own custom text box.
The Draw Text Box option is particularly useful because it gives you complete control over the size and position of your text container. After selecting this option, your cursor changes to a crosshair, and you can click and drag to create a text box of exactly the size you need.
Once you've created the text box, you simply click inside it and start typing or paste the content you want to include. The text will automatically wrap within the boundaries of the box.
Formatting text within text boxes
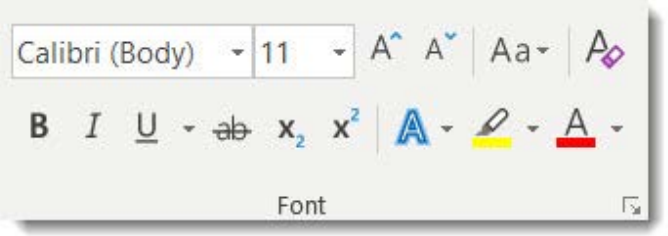
The text inside your text box can be formatted just like any other text in your document. You can change fonts, sizes, colours, and apply various formatting options using the Font group on the Home tab.
What makes text boxes special is that they have their own formatting properties. When you select a text box, the Format tab appears in the ribbon, giving you access to additional formatting options specifically designed for text boxes.
Manipulating text box properties
Text boxes offer several advanced features that make them incredibly versatile. You can move a text box by clicking on its border and dragging it to a new position. The cursor will change to a four-headed arrow when you're positioned correctly to move the box.
Resizing text boxes is accomplished using the sizing handles - small circles that appear around the border when the text box is selected. Always use the corner handles when resizing to maintain proper proportions.
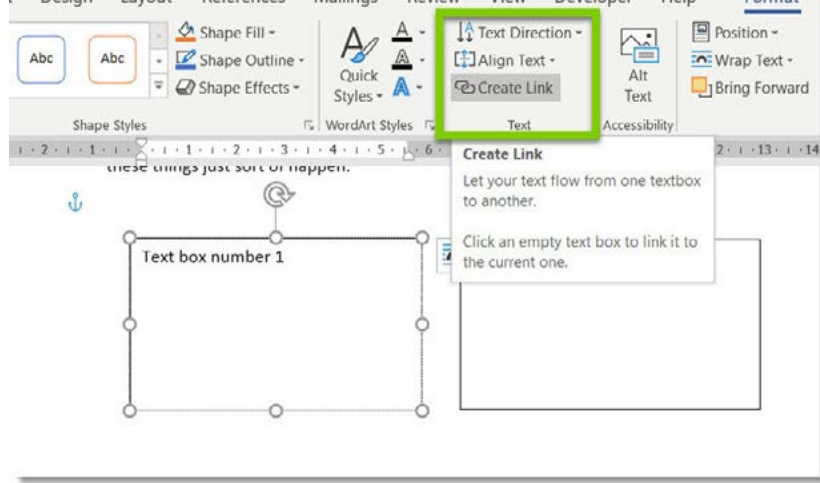
One particularly useful feature is the ability to link text boxes together. This creates a text flow from one box to another, which is helpful when you need to continue text across different parts of your document. The Create Link command in the Format tab allows you to establish these connections.
Advanced text box features
Text boxes also support various alignment and positioning options. You can set precise measurements for where the text box should appear on the page, and you can control how surrounding text wraps around the text box.
The text direction within a text box can also be modified, allowing you to create vertical text or rotate text at different angles, which can be particularly useful for creating unique design elements in your documents.
WordArt
WordArt is a feature that transforms ordinary text into decorative, stylised text with special visual effects. It's perfect for creating eye-catching headings, titles, or any text that needs to stand out from the rest of your document content.
Understanding WordArt
WordArt takes regular text and applies various artistic effects such as shadows, outlines, gradients, and three-dimensional appearances. This feature is particularly useful for creating professional-looking headers, logos, or decorative elements within your documents.
The beauty of WordArt lies in its ability to maintain text editability while applying sophisticated visual effects. You can change the actual words even after applying WordArt formatting, making it both flexible and practical.
Creating WordArt
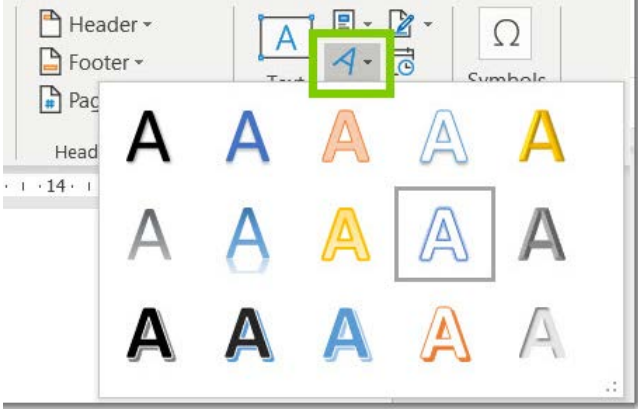
To create WordArt, you first select the text you want to transform. This could be existing text in your document or you can type new text after starting the WordArt process. From the Insert tab, you select the WordArt option, which opens a gallery of preset styles.
Each style in the WordArt gallery represents a different combination of colours, effects, and formatting. You can preview these styles by hovering over them, and once you select one, Word automatically applies it to your chosen text.
Customising WordArt effects
After creating WordArt, you gain access to additional formatting options through the Format tab. The Text Effects command provides a dropdown menu with categories like shadow, glow, reflexion, and 3D formatting.
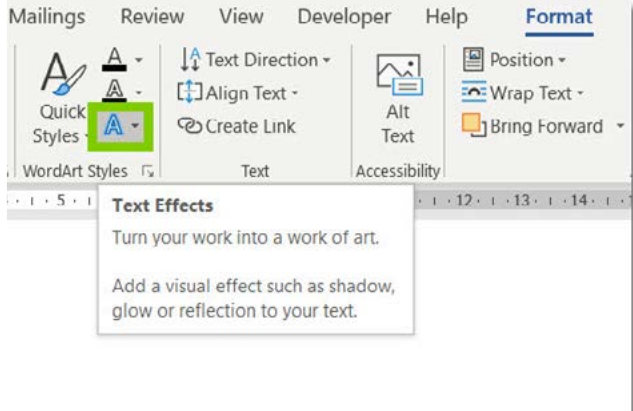
These effects can be layered and combined to create unique visual appearances. For example, you might add a shadow for depth, a glow for emphasis, and an outline for definition. Each effect category offers multiple variations and customisation options.
The key to effective WordArt is restraint - while many effects are available, using them thoughtfully will create more professional results than applying every effect possible.
Pictures and illustrations
The Illustrations group in Word provides access to various types of visual content that can enhance your documents. These include photographs from your computer, online images, clip art, icons, and other graphical elements.
Types of available illustrations
Word offers several categories of illustrations:
- Pictures from your computer or external drives
- Online pictures from web sources like Bing Image Search
- Icons for professional symbols and graphics
- 3D models for interactive visual elements
- Screenshots for capturing screen content
These illustration types serve different purposes, from decorating your document to providing informational graphics that support your written content.
Inserting and positioning pictures
When you insert a picture, Word places it at your cursor location, but you have extensive control over its final positioning. Pictures can be moved freely around your document, and you can control how text flows around them using wrapping options.
The Format tab becomes available when a picture is selected, providing tools for adjusting brightness, contrast, colour saturation, and applying various artistic effects. You can also crop pictures to show only the portions you want to include.
Resizing and formatting pictures
Proper picture resizing is crucial for maintaining image quality and document layout. Always use the corner sizing handles when resizing pictures to preserve the aspect ratio and prevent distortion.
Practical Example: Resizing an Image
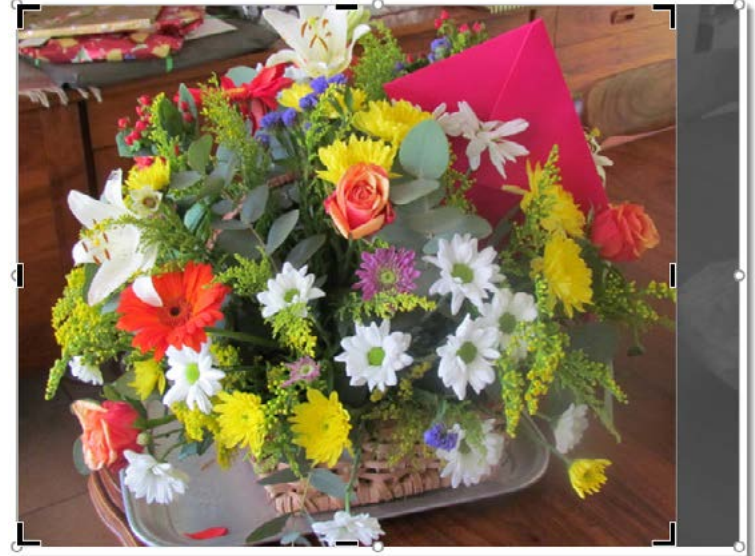
Step 1: Select the image by clicking on it
Step 2: Locate the corner sizing handles (small circles at the corners)
Step 3: Click and drag a corner handle inward to reduce size or outward to increase size
Step 4: Release the mouse button when the image reaches the desired size
This method ensures the image maintains its proper proportions without distortion.
The Format tab offers comprehensive picture editing tools including cropping, which allows you to trim unwanted portions of an image, and various artistic philtres that can change the appearance of your pictures dramatically.
You can also adjust how pictures interact with text through wrapping options. These settings determine whether text flows around the picture, appears behind it, or is displaced by the image entirely.
Shapes
Shapes in Word are geometric and artistic elements that help you create diagrams, highlight information, or add visual interest to your documents. They're particularly valuable when creating flowcharts, organisational diagrams, or simply adding visual elements to break up text.
Understanding shape categories
Word provides numerous shape categories including basic geometric shapes, arrows, flowchart symbols, callouts, and decorative elements. Each category serves specific purposes, from technical diagrams to artistic enhancement.
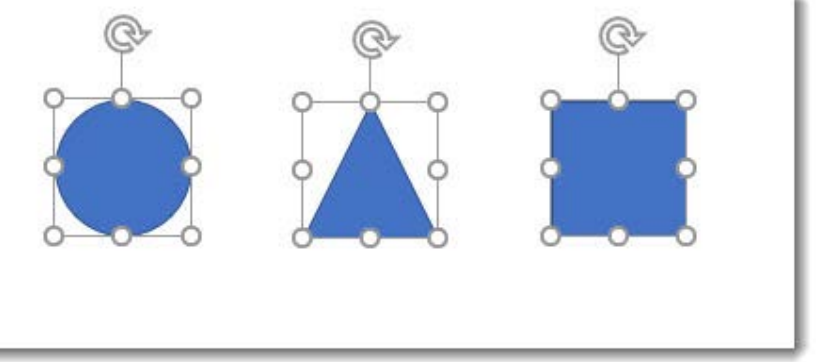
Basic shapes like rectangles, circles, and triangles form the foundation of most diagrams. Arrow shapes help show direction and flow, while callout shapes are perfect for adding explanatory text to diagrams or images.
Inserting and customising shapes
To add shapes to your document, you access the Shapes command in the Insert tab's Illustrations group. After selecting a shape, your cursor changes to a crosshair, and you can click and drag to create the shape at your desired size.
Once created, shapes can be formatted extensively. You can change their fill colour, outline properties, and apply various effects like shadows and glows. The Format tab provides comprehensive tools for shape customisation.
Shapes can also contain text, making them excellent for creating annotated diagrams or decorative text containers. Simply right-click on a shape and choose Add Text to start typing within the shape.
Working with multiple shapes
When creating complex diagrams, you'll often work with multiple shapes that need to be aligned, distributed evenly, or moved together as a unit. Word provides alignment tools that help you position shapes precisely relative to each other or to the page.
The gridlines and snap-to-grid features can help you create neat, professional-looking diagrams by ensuring shapes align properly with each other.
Grouping objects
Grouping is a powerful feature that allows you to combine multiple objects (shapes, pictures, text boxes) into a single unit that can be moved, resized, or formatted together. This is essential when creating complex graphics or diagrams with multiple components.
Benefits of grouping
When objects are grouped, they maintain their relative positions and can be manipulated as one entity. This prevents accidental displacement of elements and makes it much easier to move complex graphics around your document.
Grouping also allows you to apply formatting changes to all grouped objects simultaneously, which can save considerable time when working with multiple similar elements.
Creating groups
To create a group, you must first select multiple objects. This is done by holding the Shift key while clicking on each object you want to include in the group. Selected objects will show their selection handles simultaneously.
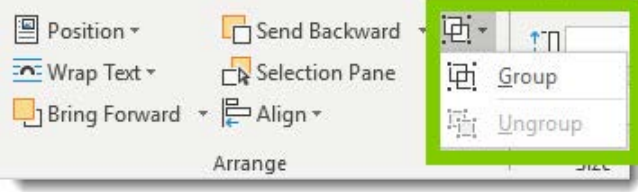
Once you have multiple objects selected, you can access the Group command in the Format tab's Arrange section. The Group option combines all selected objects into a single unit.
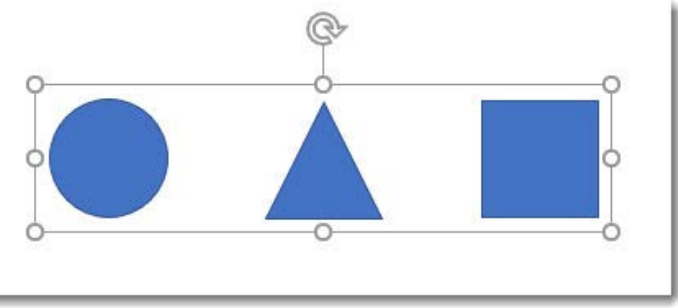
Grouped objects display a single set of selection handles around the entire group, and moving or resizing affects all components proportionally.
Managing grouped objects
Groups can be temporarily ungrouped if you need to modify individual components, then regrouped to maintain the unit structure. The Ungroup command separates the objects while keeping them selected, allowing you to make changes before regrouping.
You can also select individual objects within a group for specific modifications without fully ungrouping, though this requires careful clicking to select the specific object rather than the entire group.
Charts
Charts transform numerical data into visual representations that make information easier to understand and more compelling to readers. Word's chart feature is particularly useful for reports, presentations, and documents that need to communicate data effectively.
Understanding chart purposes
Charts help readers quickly grasp numerical relationships, trends, and comparisons that might be difficult to understand from raw data alone. Different chart types serve different purposes - bar charts for comparisons, line charts for trends, and pie charts for showing parts of a whole.
Word's charting feature uses a spreadsheet-like interface to input and edit data, making it familiar to anyone who has worked with Excel or similar programmes.
Creating charts
The chart creation process begins with selecting the Chart command from the Insert tab's Illustrations group. This opens a dialogue box where you can choose from various chart types including column, line, pie, bar, and more specialised formats.
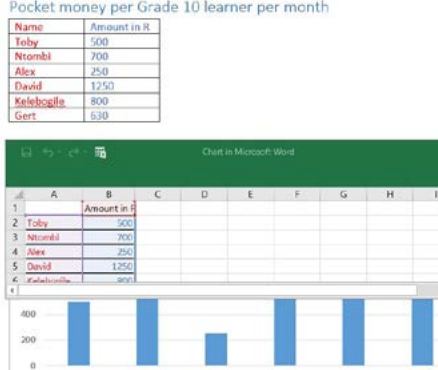
After selecting your chart type, Word inserts a sample chart with placeholder data and opens a spreadsheet window where you can input your actual information. The chart updates automatically as you modify the data in the spreadsheet.
Working with chart data
The spreadsheet interface allows you to replace the sample data with your own information. Column headers become category labels, while row headers become data series names. This structure determines how your information appears in the final chart.
You can add or remove data series and categories by modifying the spreadsheet, and the chart adjusts automatically to reflect these changes. This dynamic relationship makes it easy to experiment with different data presentations.
Formatting charts
Once your chart contains the correct data, you can format its appearance using the Design tab that appears when the chart is selected. This includes changing colours, styles, and layout options to match your document's design.
Chart elements like titles, legends, and axis labels can be customised or removed entirely depending on your needs. The formatting options allow you to create professional-looking charts that integrate seamlessly with your document design.
SmartArt
SmartArt combines text and graphics to create professional-looking diagrams that communicate information visually. It's particularly effective for showing processes, relationships, hierarchies, and other structured information that benefits from visual organisation.
Understanding SmartArt categories
SmartArt graphics are organised into categories based on their intended use:
- Lists for showing non-sequential information
- Processes for displaying steps or stages
- Cycles for showing continuous processes
- Hierarchies for organisational structures
- Relationships for showing connections between ideas
- Matrix layouts for showing relationships between quadrants
- Pyramid diagrams for showing proportional relationships
Each category contains multiple layout options, giving you flexibility in how you present your information while maintaining professional design standards.
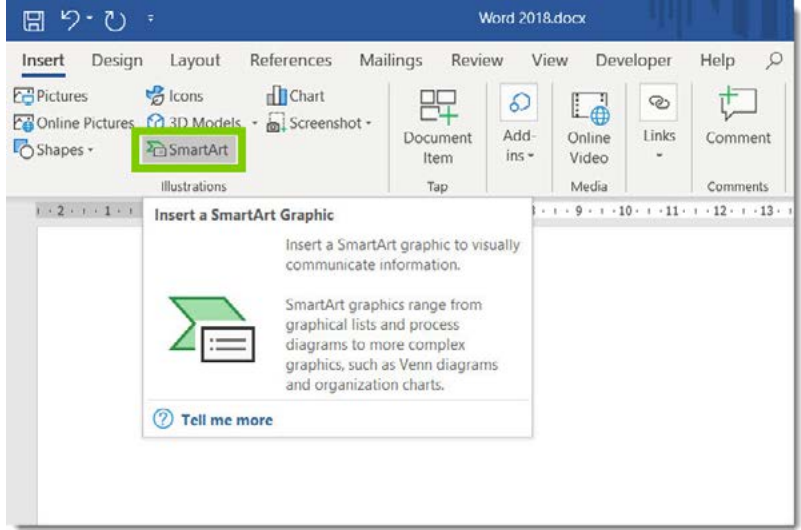
Creating SmartArt graphics
To insert SmartArt, you select the SmartArt command from the Insert tab's Illustrations group. This opens a gallery organised by categories, where you can preview different layouts and select the one that best fits your information structure.
After selecting a SmartArt graphic, it appears in your document with placeholder text that you can replace with your own content. The graphic automatically adjusts its layout to accommodate your text while maintaining proper proportions and design balance.
Adding and editing content
SmartArt graphics include built-in text areas where you can type directly. As you add text, the graphic adjusts to maintain readability and visual balance. You can also add or remove shapes within the SmartArt structure using the Design tab tools.
The text pane, which appears alongside SmartArt graphics, provides an outline-style interface for entering and organising content. This makes it easy to structure your information hierarchically and see the relationship between different elements.
Customising SmartArt appearance
SmartArt graphics can be formatted extensively using the Design and Format tabs. You can change colour schemes, apply different styles, and modify individual elements to match your document's design requirements.
The formatting options maintain the professional design integrity of SmartArt while allowing personalisation. You can adjust colours, effects, and layouts without losing the structured visual organisation that makes SmartArt effective.
Advanced techniques
Combining different graphic elements
Professional documents often combine multiple types of graphic elements to create comprehensive visual presentations. You might use shapes to create a flowchart background, add pictures for illustration, and include text boxes for detailed explanations.
When combining elements, consider using consistent formatting - similar colours, fonts, and effects - to create visual unity. The Format Painter tool can help apply consistent formatting across different types of objects.
Layout considerations
Effective use of graphics requires attention to document layout and flow. Consider how graphics interact with your text and ensure they enhance rather than interrupt the reading experience. Use appropriate white space around graphics to prevent cluttered appearance.
Text wrapping options become crucial when integrating graphics with text content. Choose wrapping styles that maintain readability while achieving your desired visual effect.
Performance and file size management
Graphics, especially high-resolution pictures, can significantly increase document file size. Consider compressing images when file size is a concern, and use appropriate image formats for different purposes.
SmartArt and shapes generally have minimal impact on file size since they're created using vector graphics that scale efficiently without quality loss.
Key Points to Remember:
-
Text boxes provide flexible text positioning - Use them to create callouts, sidebars, or position text anywhere in your document independently of normal text flow.
-
WordArt transforms text into visual elements - Perfect for creating eye-catching headings and titles, but use restraint to maintain professionalism.
-
Pictures enhance document appeal - Always resize using corner handles to maintain proportions, and consider text wrapping options for proper integration.
-
Shapes and grouping enable complex diagrams - Combine multiple shapes and group them to create professional diagrams that move and resize as single units.
-
Charts make data understandable - Transform numerical information into visual formats that readers can quickly comprehend and analyse.
-
SmartArt organises information visually - Use appropriate SmartArt categories to show processes, relationships, and hierarchies in professional-looking graphics.