Basic Integration Techniques: Charts and Tables (Grade 10 NSC Matric Computer Application Technology): Revision Notes
Basic Integration Techniques: Charts and Tables
When creating presentations, you often need to include data visualisations and organised information. Understanding how to properly integrate charts and tables into your presentations will make your work more professional and engaging. Let's explore the different methods you can use to add these elements effectively.
Mastering chart and table integration is essential for creating professional presentations that effectively communicate your data and information to your audience.
Charts
Charts are powerful visual tools that can transform raw data into easily understood graphics. There are several ways to add charts to your presentations, each with its own advantages and considerations.
Inserting charts directly into presentations
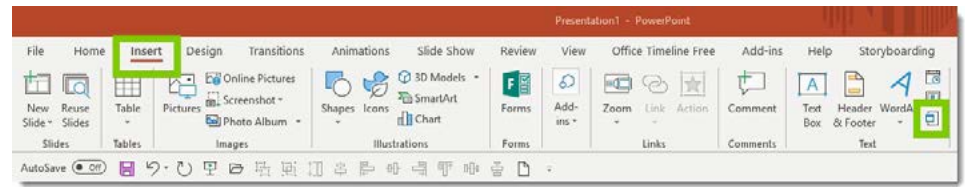
The most straightforward approach is to create a chart directly within your presentation software. When you need to add a chart, you'll work with the Insert tab and navigate to the appropriate tools.
Step-by-Step: Creating a Chart Directly
- Access the Insert tab in your presentation software
- Look for the Illustrations group and find the Chart command
- Select the Chart option to open the dialogue box
- Choose the chart type that best suits your data
- Click OK to open the spreadsheet window
- Replace the sample data with your own information
- Close the spreadsheet window to see your chart on the slide
The beauty of this approach is that you can customise both the data and the appearance of your chart. Once you've entered your data and closed the spreadsheet window, your chart appears on the slide ready for further formatting or repositioning.
Copying charts from other applications
Sometimes you may have already created a perfect chart in a spreadsheet application and want to use it in your presentation. This method involves copying the chart from your original application and pasting it into a placeholder on your presentation slide. This approach works well when you have existing charts that don't need to be updated frequently.
Importing charts from spreadsheets
For charts that may need regular updates, importing provides a more sophisticated solution. This method allows you to maintain a connection between your presentation and the original spreadsheet data.
When importing a chart, you'll navigate to the Insert tab and look for the Text group where you'll find the Insert Object command. This opens a dialogue box where you'll select "Create from file" and then browse to locate your spreadsheet. An important consideration here is the Link option - if you select this, any changes made to the original spreadsheet will automatically update in your presentation.
The linking feature is particularly useful for presentations that use data that changes regularly, such as sales figures or performance metrics. However, it's crucial to understand that if you move or delete the original spreadsheet file, the link will break and your chart may not display properly in the presentation.
Critical File Management Warning
Once you've imported a chart from a spreadsheet, never delete or move the original spreadsheet file. If you do this accidentally, you'll need to re-insert the chart to restore it in your presentation. Keep your files organised and in consistent locations to prevent these issues.
Tables
Tables provide an excellent way to present structured data in a clear, organised format. While you can copy tables from other applications, presentation software also allows you to create tables directly within your slides.
Creating tables directly in presentations
When you need a fresh table for your presentation, you can create one from scratch using the built-in table tools. Access the Insert tab and look for the Images group where you'll find the Table command. Selecting this opens a drop-down menu where you can choose "Insert Table."
Step-by-Step: Creating a New Table
- Navigate to the Insert tab
- Locate the Images group and click Table command
- Select "Insert Table" from the drop-down menu
- In the Insert Table dialogue box, specify the number of rows and columns needed
- Click OK to insert the table onto your slide
- Begin adding your content to the table cells
The Insert Table dialogue box allows you to specify exactly how many rows and columns you need for your data. Once you've made your selections and clicked OK, the table appears on your slide ready for content.
Working with table formatting
After inserting your table, you can add content and apply formatting using the same skills you've learned in word processing applications. This includes adjusting font sizes, colours, borders, and cell alignment to make your table both functional and visually appealing.
Consider this example of how tabular data might appear in a presentation:
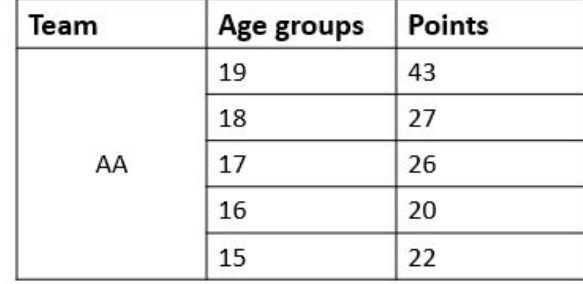
This type of structured presentation makes it easy for your audience to compare different values and understand relationships in your data. The clear organisation helps viewers quickly identify key information without having to search through paragraphs of text.
Best practices for table integration
When working with tables in presentations, remember that your audience will be viewing them from a distance. Use larger fonts than you might in a document, ensure there's sufficient contrast between text and background colours, and avoid overcrowding cells with too much information. Keep your tables focused and relevant to your presentation's key messages.
Always consider your audience's viewing experience when designing tables. What looks good on your computer screen may be difficult to read when projected in a presentation room.
Key Points to Remember:
-
Chart insertion methods: You can create charts directly in presentations, copy them from other applications, or import them with data links from spreadsheets
-
File management is crucial: When importing charts from external files, never move or delete the original files as this will break the connection and affect your presentation
-
Link wisely: Use the Link option when importing charts only if you need automatic updates - otherwise, simple copying may be more reliable
-
Table creation: Tables can be inserted directly into presentations using the Insert tab, and you can apply familiar formatting techniques to make them clear and professional
-
Audience consideration: Always format charts and tables with your audience in mind - use appropriate sizes, colours, and layouts that will be visible and understandable from a distance