Tables (Grade 10 NSC Matric Computer Application Technology): Revision Notes
Tables
Understanding tables
Tables are powerful tools used to organise information in a structured way. They can contain both numbers and text, making them perfect for presenting data clearly and professionally. Think of a table as a grid where information is arranged systematically, making it easy to read and understand.
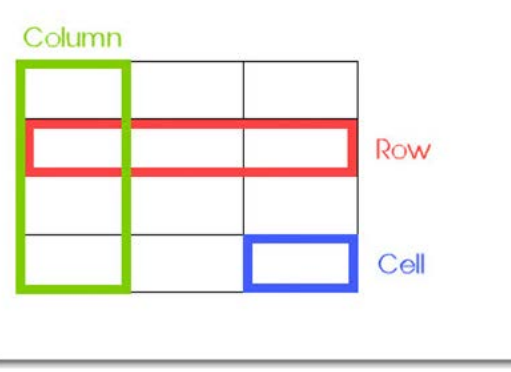
A table consists of three main components that work together to create an organised structure for your data:
- Rows: These run horizontally across the table and contain related information
- Columns: These run vertically down the table and group similar types of data
- Cells: These are the individual boxes where rows and columns intersect, and where you actually type your information
Understanding these basic building blocks is essential because everything you do with tables involves working with rows, columns, and cells in different ways.
Creating tables
Inserting a blank table
To create a table in a word processing application, you'll use the Insert menu. When you select the Table command, a drop-down menu appears showing a grid. This grid allows you to visually select how many columns and rows you want by moving your mouse over it. Once you see the size you need, simply click to insert the table into your document.
Using the Insert Table dialogue box
For more precise control over your table, you can use the Insert Table dialogue box instead. This method is particularly useful when you need tables with many rows or columns, or when you want to set specific properties from the start.
The dialogue box allows you to specify exact numbers of columns and rows, and offers AutoFit options that automatically adjust your table's appearance based on its content or the page width.
Table design and formatting
Once you've created a table, you'll want to make it look professional and easy to read. Word processing applications provide extensive formatting options through the Table Tools.
Table styles
Table styles are pre-designed combinations of colours, borders, and formatting that you can apply to your entire table with just one click. These styles ensure your table looks consistent and professional without requiring you to format each element individually.
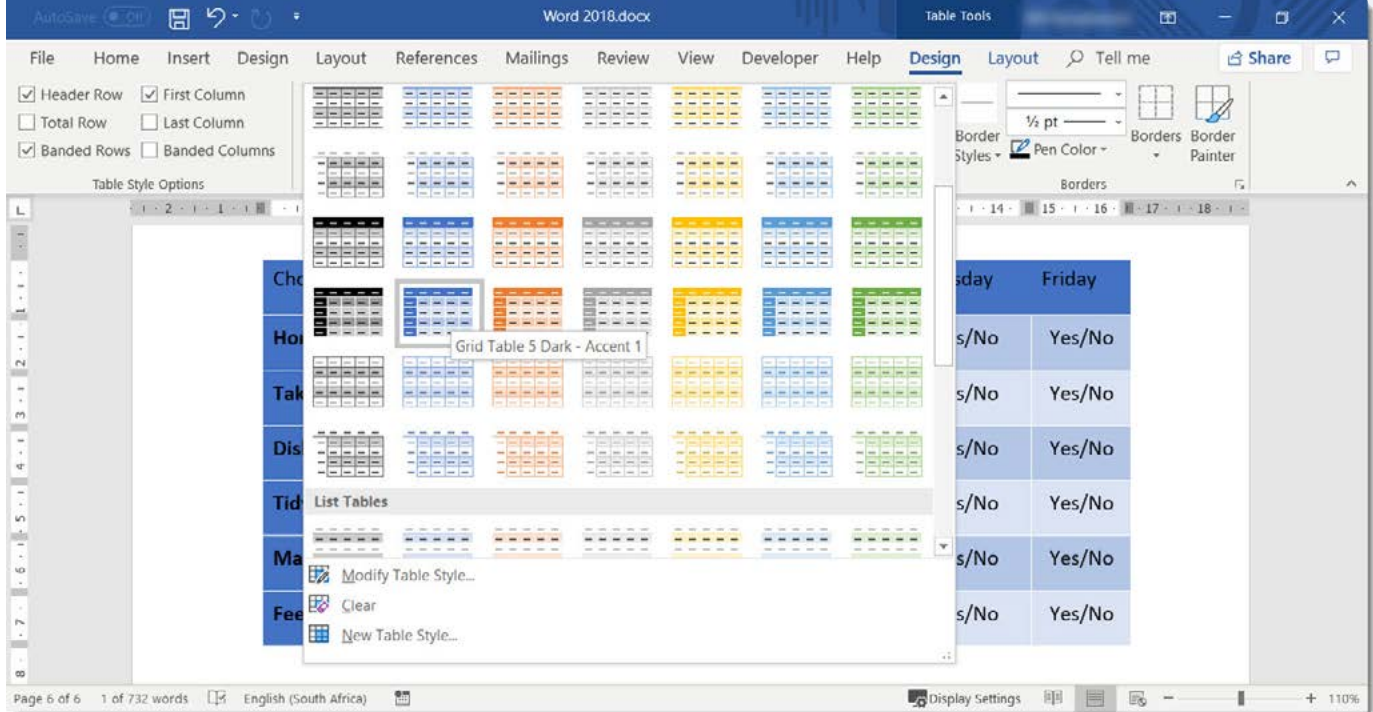
You can choose from various colour schemes and designs, including options with alternating row colours (called banded rows) or special formatting for header rows and first columns.
Table properties and customisation
Table Properties gives you detailed control over your table's appearance and behaviour. You can access advanced options for borders, shading, alignment, and size measurements.
Key areas you can customise include:
- Size: Control the overall width of your table and how it fits on the page
- Alignment: Position your table to the left, centre, or right of the page
- Text wrapping: Determine how text flows around your table
- Borders and shading: Add or modify lines around cells and background colours
Table layout management
Working with rows and columns
The Layout tab provides tools for managing your table's structure. You can easily insert or delete rows and columns, which is extremely helpful when you need to add more data or remove unnecessary sections.
When inserting new rows or columns, you can choose exactly where they appear - above, below, left, or right of your current selection. This flexibility allows you to modify your table structure even after you've entered data.
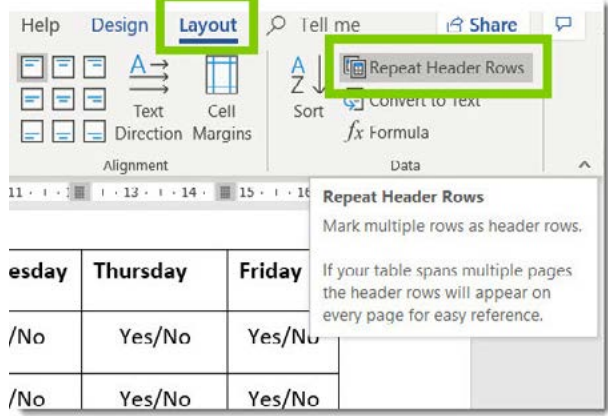
Header rows
Header rows are special rows that contain column titles or labels. These are particularly important when your table spans multiple pages, as header rows can be set to repeat automatically at the top of each page, ensuring readers always know what each column represents.
Gridlines
Gridlines are light lines that help you see the table structure while you're working, even when your table doesn't have visible borders. You can turn gridlines on or off depending on whether they help or distract from your work.
Table cells
Merging cells
Sometimes you'll want to combine two or more cells into one larger cell. This process is called merging, and it's useful for creating titles that span multiple columns or grouping related information together.
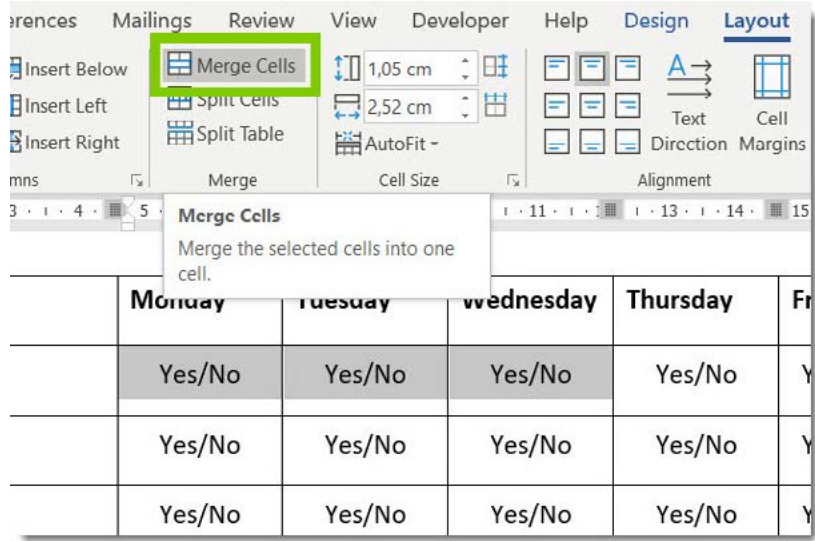
To merge cells, you select the cells you want to combine and then use the Merge Cells command. The content from all selected cells will be combined into the new merged cell.
Splitting cells
The opposite of merging is splitting, where you divide one cell into multiple cells. This is helpful when you need to add more detailed information to a section of your table.
AutoFit
AutoFit is a time-saving feature that automatically adjusts column widths or row heights based on the content in your table. This ensures that all your text is visible without having to manually resize each column.
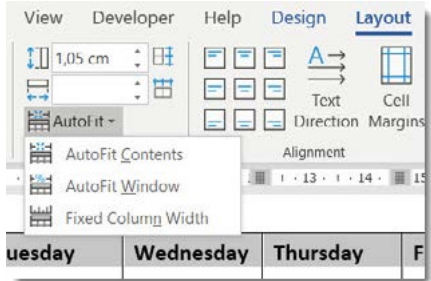
AutoFit offers several options:
- AutoFit Contents: Adjusts column widths to fit the text perfectly
- AutoFit Window: Makes the table fit the width of the page
- Fixed Column Width: Keeps columns at a set width regardless of content
Cell size management
You can manually control the size of individual cells or entire rows and columns. This is useful when you need specific dimensions for your table or when automatic sizing doesn't give you the appearance you want.
Cell sizing can be adjusted by:
- Dragging borders with your mouse
- Using the Cell Size controls in the Layout tab
- Setting specific measurements in centimetres or inches
Distribution
When your table looks uneven, the distribution feature helps by making selected rows or columns the same size. This creates a more balanced, professional appearance.
Text alignment and direction
Within each cell, you can control how text is positioned and oriented. Text can be aligned to the left, centre, or right horizontally, and to the top, middle, or bottom vertically. You can even rotate text to run vertically instead of horizontally, which is useful for narrow columns with longer labels.
Cell margins
Cell margins control the space between the cell border and the text inside the cell. Proper margins make your table easier to read by ensuring text doesn't appear cramped against the cell borders.
Working with data in tables
Tables become even more powerful when you use them to organise and analyse data. Word processing applications include several tools specifically designed for working with table data.
Sorting data
Sorting arranges your table data in alphabetical order (A-Z or Z-A) or numerical order (ascending or descending). This makes it easier to find specific information or identify patterns in your data.
When sorting, you can choose which column to sort by and whether you want ascending (smallest to largest) or descending (largest to smallest) order. The sort feature will move entire rows together, keeping related information properly aligned.
Using formulas in tables
Tables can perform calculations using formulas, similar to spreadsheet applications. This is particularly useful for totals, averages, and other mathematical operations.
Basic Table Functions
The three fundamental functions you can use in tables are:
| Function | Purpose |
|---|---|
| SUM | Adds all the values in selected cells |
| AVERAGE | Calculates the mean of values in selected cells |
| COUNT | Counts cells containing numerical or text values |
These functions work just like in spreadsheet applications, making calculations automatic and error-free.
You can also use directional formulas that work with cells in specific positions:
| Formula | Purpose |
|---|---|
=SUM(ABOVE) | Adds numbers in the column above the selected cell |
=SUM(LEFT) | Adds numbers in the row to the left of the selected cell |
=SUM(BELOW) | Adds numbers in the column below the selected cell |
=SUM(RIGHT) | Adds numbers in the row to the right of the selected cell |
Converting text to tables
Sometimes you'll have information already typed as regular text that would work better as a table. The Convert Text to Table feature can automatically create a table from existing text, saving you from having to retype everything.
This feature works best when your text is already separated consistently, such as with tabs, commas, or other characters that can be used to identify where column breaks should occur.
Exam tips and common pitfalls
Key Points to Remember:
- Always plan your table structure before you start entering data
- Use header rows for tables that span multiple pages
- Keep formatting consistent throughout your table
- Test formulas with simple calculations to ensure they're working correctly
- Save your work frequently when working with complex tables
Common mistakes to avoid:
- Forgetting to merge cells when creating table titles
- Using too many different fonts or colours, which makes tables look unprofessional
- Not checking that formulas update correctly when you add or remove data
- Making column widths too narrow, causing text to wrap awkwardly
Remember!
Essential Table Concepts:
- Tables organise information using rows (horizontal), columns (vertical), and cells (intersections)
- Use Insert > Table to create new tables, with options for size and AutoFit behaviour
- Table Tools provides Design options for styling and Layout options for structure management
- Merge cells to combine them, split cells to divide them, and use AutoFit for automatic sizing
- Tables support basic calculations with formulas like , , and , plus sorting for data organisation