Concepts Used in Information Management (Grade 10 NSC Matric Computer Application Technology): Revision Notes
Concepts Used in Information Management
What is information management?
Information management is a systematic process that helps us achieve our goals, whether in school, business, or any other environment. Think of it as a way to determine if you're on track to meet your objectives - like checking if a company is making a profit or if students are performing well in their studies.
This process can be understood through three essential steps that work together like a recipe for success.
Information management isn't just for businesses - you use it every day when you organise your study notes, track your grades, or plan your assignments. It's a fundamental skill that applies to virtually every aspect of life.
The three steps of information management
1. Inputs
This is where everything begins. Inputs are the raw materials we collect - primarily data. Data consists of raw, unorganised numbers, signals, or facts that haven't been processed yet. It's like having all the ingredients for a cake but not yet knowing what you're going to bake.
2. Processing
During this stage, we take our raw data and transform it into something meaningful. We organise, analyse, and manipulate the data to make sense of it. This is like following a recipe to turn your ingredients into an actual cake.
3. Outputs
This final step produces information - organised facts and numbers that are actually useful for people. Information is data that has been processed and organised so that it serves a purpose and helps with decision-making.
Critical Distinction: The transformation from data to information is what makes the entire process valuable. Without proper processing, even the best data remains useless raw material.
Understanding the difference between data and information
The key difference is that data is raw and unorganised, while information is processed and useful. Let's look at a practical example:
Case study: Tracking class performance
Imagine your Mathematics teacher wants to see how well your current class is performing compared to last year's class. The process would work like this:
Worked Example: Converting Data to Information
Step 1 - Inputs (Data): The teacher collects raw test scores, homework marks, and assignment grades from both years - just numbers on pages.
- 2023 Class: 67, 45, 78, 89, 56, 71, 82...
- 2024 Class: 72, 83, 79, 91, 68, 77, 85...
Step 2 - Processing: The school's database converts this raw data into averages, comparing the two years and creating meaningful comparisons.
- Calculation:
- Calculation:
Step 3 - Outputs (Information): The teacher receives a clear report showing that this year's class average is 78% compared to last year's 71%, indicating improved performance.
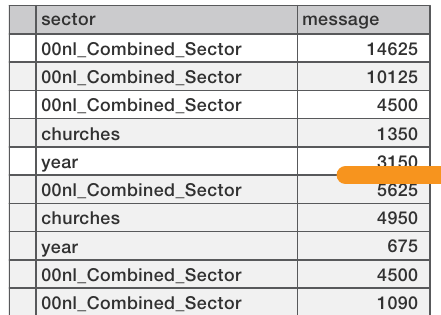
This table shows how raw data appears before processing - just numbers and categories that need to be organised.
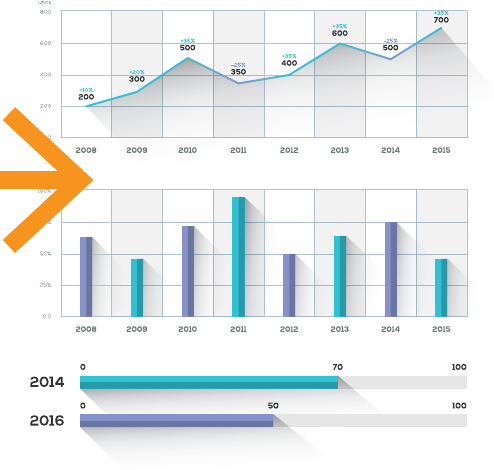
This dashboard demonstrates how data gets transformed into visual information through charts, graphs, and progress indicators that are easy to understand and use for decision-making.
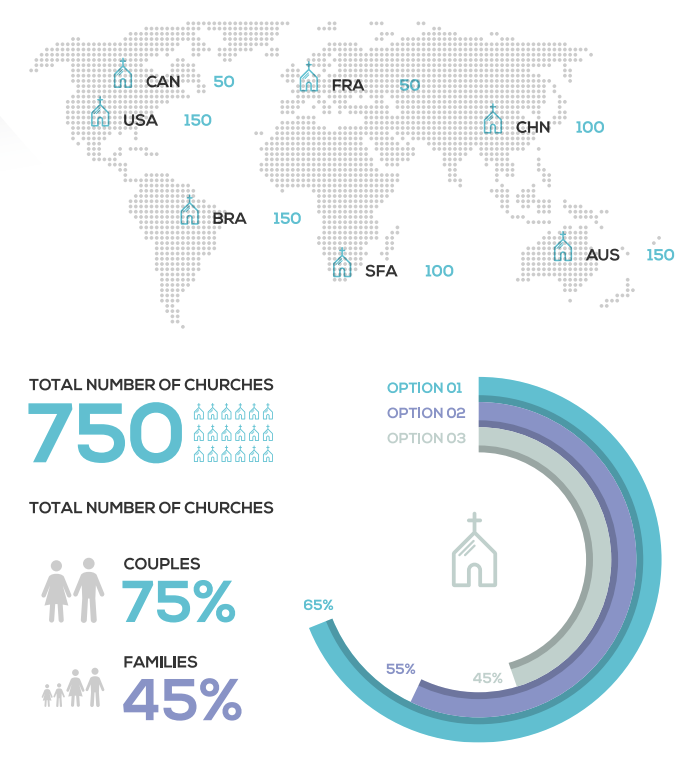
This infographic shows the final output stage - complex data has been converted into clear, visual information that tells a story about global church distribution and demographics.
Information management in your PAT (Practical Assessment Task)
When completing your PAT, you'll follow the same three-phase process. Understanding this structure will help you approach your project systematically and achieve better results.
Phase 1 - Inputs
This phase focuses on gathering quality information. You'll need to:
- Research your specific topic thoroughly
- Create questions that help identify problems you'll encounter
- Understand what kind of quality information you need
- Collect relevant data from various sources (printed media, internet research)
- Gather information using methods you learned in previous chapters
Research Tip: Quality is more important than quantity when gathering inputs. A few reliable, relevant sources will serve you better than dozens of superficial ones.
Phase 2 - Processing
After collecting all your data, you must:
- Understand what the information means
- Find solutions to problems identified in Phase 1
- Use computer applications like spreadsheets to process and analyse data
- Apply appropriate software tools to make sense of your collected information
Processing Tools: Don't just collect data - transform it! Use formulas, create charts, identify patterns, and draw meaningful conclusions from your raw information.
Phase 3 - Outputs
The final phase involves presenting your processed information:
- Create reports or presentations that others can understand
- Apply skills from word processing, spreadsheets, and presentation software
- Make your information clear and accessible to your intended audience
- Present your analysed information in a professional format
Presentation Matters: Your outputs should tell a clear story. Even the most brilliant analysis is worthless if your audience can't understand or use it.
Key benefits of proper information management
When you follow this systematic approach, you can:
- Make better decisions based on organised facts rather than guesswork
- Track progress towards your goals effectively
- Identify problems early and find solutions
- Present your findings in ways that others can easily understand and use
Key Benefits to Remember:
- Improved decision-making through organised facts
- Clear progress tracking towards objectives
- Early problem identification and solution finding
- Effective communication of findings to others
Remember!
Key Points to Remember:
- Information management follows three steps: Inputs → Processing → Outputs
- Data is raw and unorganised - like scattered puzzle pieces
- Information is processed and useful - like a completed puzzle that shows the full picture
- Quality information gathering is crucial for your PAT success
- Each phase builds on the previous one - you can't skip steps and expect good results
- The goal is always to create something useful that helps with decision-making