Processing Data (Grade 10 NSC Matric Computer Application Technology): Revision Notes
Processing Data
What is data manipulation?
Data manipulation is the process where information is changed to make it easier to understand or read. This is a crucial part of the third phase of your Practical Assessment Task (PAT), where you focus on processing and using the data you collected in Phase 2. The goal is to transform raw data into meaningful information that can help you make decisions and draw conclusions.
This phase is critical for your PAT success - it bridges the gap between data collection and meaningful analysis. Take time to understand each concept thoroughly as you'll be applying these skills throughout your assessment.
Knowledge versus insight and decision making
Understanding the difference between knowledge and decision making is essential for effective data processing:
Knowledge refers to the information that people collect in order to make an analysis. This is the raw data and facts you gather during your research phase.
Decision making (wisdom) happens when people put everything together and actually do something about it. This is when you use your processed knowledge to make informed choices or recommendations.
Critical Distinction:
- Knowledge = Collecting and recognising information
- Decision Making = Acting on that information to solve problems
Don't confuse having information with using it effectively!
Practical Example: Teacher's Data Analysis
Scenario: Teacher A realises that her learners are struggling with certain sections in the curriculum, especially in Term 2.
Knowledge stage: Recognising the problem through test results and observations Decision making stage: Creating and implementing a remedial teaching plan
This shows how data processing leads to actionable solutions.
The importance of information manipulation
When you have gathered your data, you need to manipulate it to make it useful. Data manipulation involves several key techniques that transform your raw information into actionable insights:
- Identifying core meaning: Find the most important points in your collected information
- Summarising: Put the information into your own words and add your own conclusions or opinions
- Visual representation: Use graphs, tables and illustrations to show your information clearly
These techniques ensure that your data tells a clear story and supports your research objectives.
Data processing steps
Effective data processing follows a systematic approach with four main steps that work together to transform your raw data into meaningful results:
The Four-Step Data Processing Framework:
Step 1: Group - Organise data according to research questions
Step 2: Create hierarchies - Structure information logically\
Step 3: Calculations - Apply mathematical analysis
Step 4: Using graphs - Create visual representations
Follow these steps in sequence for best results.
Step 1: Group
Organise your data according to the questions you asked in your research. You can highlight important data or information and group it accordingly. This helps you see patterns and relationships in your data.
Step 2: Create hierarchies
Organise the information in a logical order to show where highlighted information or data belongs. This creates a structure that makes your data easier to understand and analyse.
Step 3: Calculations
Use the skills you learned in spreadsheets to analyse your data. You can count items in your spreadsheet and use functions like MIN, MAX and AVERAGE to find patterns. For example, you might count how many learners bought chips from the tuck shop on Tuesday.
Step 4: Using graphs
Graphs are an excellent way to represent data visually. Charts and graphs make it much easier for others to understand your findings quickly and clearly.
Data handling using spreadsheets
When working with real data, you'll often deal with much larger datasets than what you see in textbooks. In professional situations, people work with hundreds and thousands of data items that need analysis.
For your PAT, you're using a smaller sample to demonstrate that you can process larger datasets. When handling data, you'll typically ask questions like:
- How many?
- What is the most popular?
- What is the least popular?
- How many more than?
- What is the average?
These questions form the foundation of data analysis. Each question type requires different Excel functions and approaches, so understanding what you're trying to find helps you choose the right tools.
Processing data using spreadsheets
Spreadsheet programmes like Microsoft Excel are excellent tools for data processing because they can perform calculations automatically using formulas. Think of Excel as a powerful calculator that can add, multiply, subtract and even divide large sets of numbers instantly.
Mathematical operators
Excel uses standard mathematical symbols that you already know:
- Plus sign (+) for addition
- Minus sign (-) for subtraction
- Asterisk (*) for multiplication
- Forwards slash (/) for division
Essential Formula Rule: All formulas in Excel must begin with an equals sign (=).
This tells Excel that you're entering a formula, not just text. Forgetting the equals sign is a common mistake that prevents your calculations from working.
Essential Excel functions for data processing
These functions help you analyse large sets of data quickly and accurately:
- SUM: Calculates the total of a range of numbers
- AVERAGE: Gives you the average of a range of values
- MIN: Returns the minimum (smallest) value in a list
- MAX: Returns the maximum (largest) value in a list
- COUNT: Counts the numbers in a list of values
While these functions are excellent for interpreting large datasets, they don't help much with visualising the data. For that, you'll need to create charts and graphs.
Using the COUNTIF function
After gathering your information, you need to transfer the data to an Excel spreadsheet. Once there, you should use the COUNTIF function to count how many times each answer appears for each question.
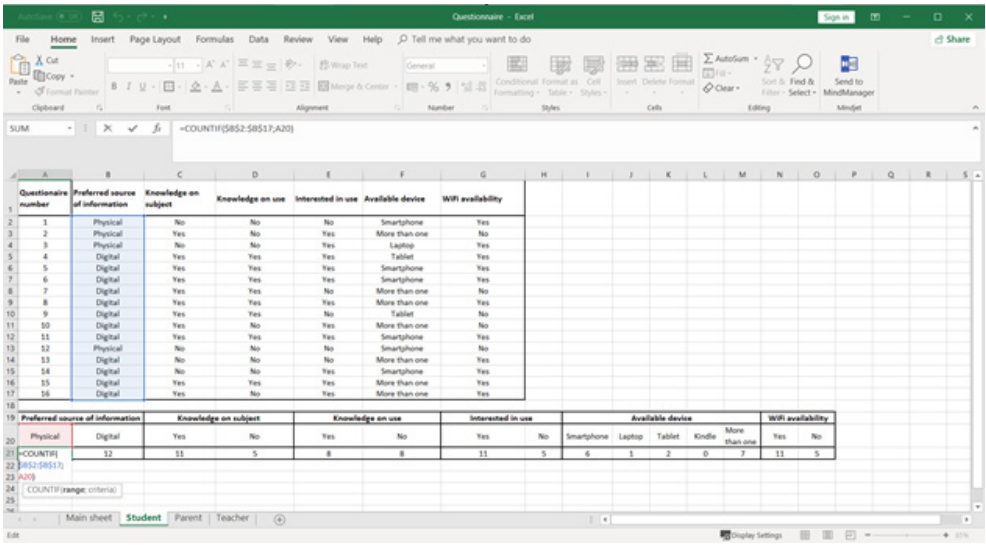
The COUNTIF function is particularly useful because it allows you to count specific responses automatically. For example, if you want to know how many people answered "Yes" to a particular question, COUNTIF can count all the "Yes" responses instantly.
Using COUNTIF for Survey Analysis
Scenario: You have 100 survey responses and want to count how many people answered "Chocolate" as their favourite ice cream flavour.
Formula: =COUNTIF(A1
,"Chocolate")This formula will automatically count every cell in the range A1 to A100 that contains exactly "Chocolate".
This function helps you get proper figures to answer your initial research questions and provides the foundation for creating meaningful graphs and charts.
Exam tips
Key Strategies for Success:
- Practice Excel functions: Make sure you can use SUM, AVERAGE, MIN, MAX, COUNT, and COUNTIF confidently
- Remember the equals sign: All Excel formulas must start with =
- Plan your data processing: Follow the four-step process (Group, Create hierarchies, Calculations, Using graphs) systematically
- Check your work: Always verify your calculations and ensure your data makes sense
- Use appropriate graphs: Choose chart types that best represent your specific data
Remember!
Essential Takeaways:
- Data manipulation transforms raw information into meaningful insights that support decision making
- Knowledge is collecting information, while decision making is acting on that information
- Follow the four-step process: Group, Create hierarchies, Calculations, and Using graphs
- Excel functions like COUNTIF, SUM, and AVERAGE make data analysis much faster and more accurate
- Always start Excel formulas with an equals sign (=) and use standard mathematical operators