Demand, Supply, and Price (Grade 10 NSC Matric Economics): Revision Notes
Demand, Supply, and Price
Understanding demand
Demand is a fundamental concept in economics that describes how much of a product or service people are willing to purchase at different price levels. However, it's important to understand that there are different types of demand that economists consider.
Effective demand refers to the actual purchasing power that consumers have. This means that people not only want to buy something, but they also have the money available to make the purchase. This is different from simply wanting something - you need both the desire and the financial ability to buy it.
The distinction between wanting something and having effective demand is crucial in economics. For example, many people might want a luxury car, but only those with sufficient income have effective demand for it.
When we talk about demand, we can look at it from two perspectives:
- Individual demand represents how much one person or one household plans to buy
- Market demand is the combined total demand of all consumers in a particular market
Think of it this way: if you want to buy 2 chocolate bars per week, that's your individual demand. But if we add up what you and everyone else in your town wants to buy, that gives us the market demand for chocolate bars in your area.
The relationship between demand and price
One of the most important principles in economics is understanding how price affects consumer behavior. The fundamental relationship between these two variables forms the basis of economic theory.
The Law of Demand: Demand and price have an inverse relationship. This means:
- When prices fall, the quantity demanded increases
- When prices rise, the quantity demanded decreases
This makes intuitive sense. If your favourite snack becomes cheaper, you're likely to buy more of it. If it becomes more expensive, you'll probably buy less or look for alternatives.
The demand curve
The demand curve is a visual way to show the relationship between price and quantity demanded. This graphical representation helps economists and businesses understand consumer behavior patterns.
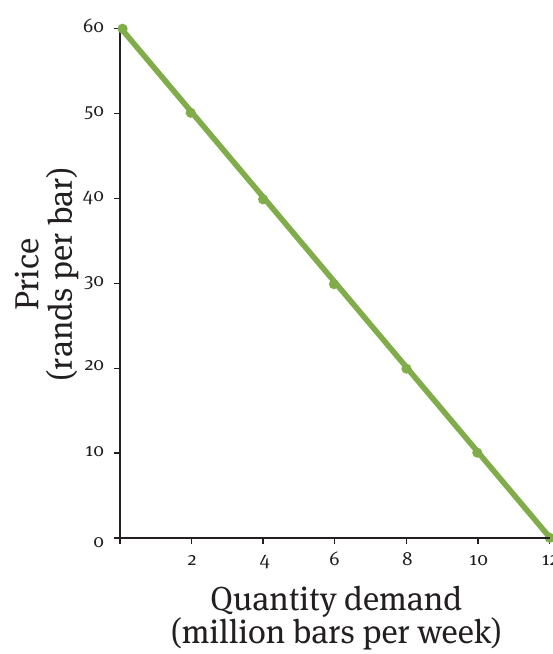
Worked Example: Chocolate Bar Demand Schedule
Let's examine how demand for chocolate bars changes with price:
| Price (rands per bar) | Quantity demand (million bars per week) |
|---|---|
| 0 | 12 |
| 10 | 10 |
| 20 | 8 |
| 30 | 6 |
| 40 | 4 |
| 50 | 2 |
| 60 | 0 |
| 70 | 0 |
This data shows the downward-sloping demand curve. As the price increases from left to right, the quantity demanded decreases.
This graph clearly demonstrates how consumers respond to price changes in the market. The downward slope is a visual confirmation of the inverse relationship between price and demand.
Other factors that influence demand
While price is the main factor affecting demand, several other elements can shift the entire demand curve. Understanding these non-price factors is essential for predicting market behavior.
These factors are called "non-price determinants of demand" because they affect demand independently of the product's price.
The key factors include:
- Advertising: Effective marketing campaigns can increase demand for products by making consumers more aware of them or creating desire
- Economic cycles: During economic recessions, people have less disposable income to spend, which reduces overall demand for most goods
- Fashion trends: What's popular or trendy can significantly impact demand, especially for clothing, accessories, and lifestyle products
- Weather conditions: Seasonal changes affect demand for many products (ice cream in summer, heating in winter)
- New or better alternative products: When superior substitutes enter the market, demand for existing products may decrease
- Technological changes: New technology can create demand for new products or reduce demand for outdated ones
Understanding curve movements vs curve shifts
This distinction is one of the most important concepts in demand analysis. Many students confuse these two different types of changes, but understanding the difference is crucial for economic analysis.
Critical Distinction:
- Movement along the demand curve: This happens when only the price changes. You move up or down the same curve
- Shift of the entire demand curve: This occurs when any of the non-price factors change, moving the whole curve left or right
When the demand curve shifts to the right, it means demand has increased at every price level. When it shifts to the left, demand has decreased at every price level. These shifts represent fundamental changes in consumer preferences or market conditions.
Practical applications
Understanding demand theory provides valuable insights for real-world decision making. These economic principles have direct applications in business strategy and consumer behavior analysis.
Understanding demand helps businesses make important decisions about:
- Pricing strategies: Knowing how sensitive customers are to price changes
- Production planning: Anticipating how much to produce based on expected demand
- Marketing investments: Understanding which non-price factors might boost demand
- Seasonal planning: Preparing for predictable changes in demand throughout the year
For South African consumers, these concepts explain everyday experiences like why braai meat prices might rise during festive seasons (increased demand) or why winter clothing goes on sale in summer (decreased demand).
Key Points to Remember:
- Demand is the quantity people are willing and able to buy at different prices
- Price and demand have an inverse relationship - when one goes up, the other goes down
- The demand curve slopes downward from left to right, showing this inverse relationship
- Non-price factors like advertising, economic conditions, fashion, weather, new products, and technology can shift the entire demand curve
- Price changes cause movement along the curve, while changes in other factors cause the whole curve to shift