Supply and Price (Grade 10 NSC Matric Economics): Revision Notes
Supply and Price
Understanding supply
Supply refers to the amount of goods or services that producers are prepared to offer to the market at different price levels. This is a fundamental concept in economics that helps us understand how markets work.
The key principle behind supply is that producers want to make a profit. When prices go up, producers become more willing to supply their goods because they can earn more money. When prices fall, they become less willing to supply because their potential profits decrease.
This positive relationship between price and quantity supplied is what makes supply different from demand. While consumers typically want to buy less when prices rise, producers want to sell more when prices rise because of the profit motive.
The supply curve
The supply curve is a graph that demonstrates the relationship between price and the quantity that producers are willing to supply. It's one of the most important tools for understanding market behaviour.
Supply schedule
Before we look at the curve, let's examine the data that creates it. The supply schedule shows the relationship between price and quantity supplied in table format:
Worked Example: Interpreting a Supply Schedule
| Price (rands per bar) | Quantity supplied (million bars per week) |
|---|---|
| 0 | 0 |
| 10 | 0 |
| 20 | 2 |
| 30 | 4 |
| 40 | 6 |
| 50 | 8 |
| 60 | 10 |
| 70 | 12 |
Analysis: This table shows that as the price increases from 20 rands to 70 rands per bar, the quantity supplied increases from 2 million to 12 million bars per week. Notice that at very low prices (0-10 rands), suppliers are not willing to produce anything at all because the price doesn't cover their costs.
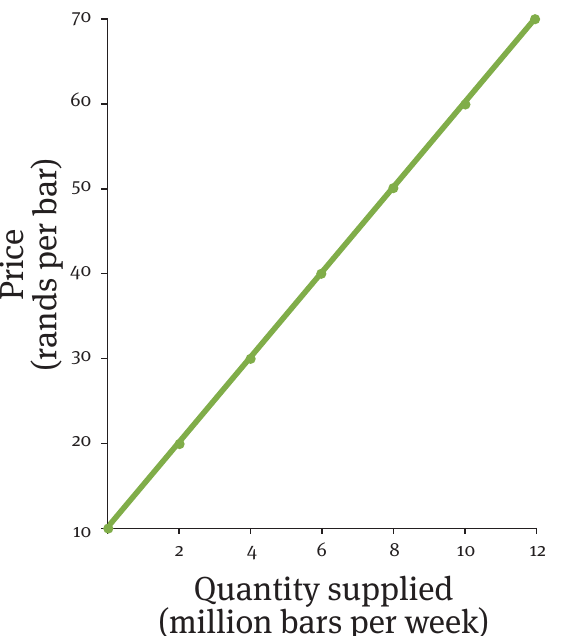
The supply curve slopes upward from left to right, showing the positive relationship between price and quantity supplied. This upward slope represents the law of supply - as prices increase, the quantity supplied increases, and as prices decrease, the quantity supplied decreases.
The law of supply is fundamental to understanding market economics. Remember: higher prices = higher quantity supplied. This happens because producers can make more profit at higher prices, making production more attractive.
Factors that influence supply
While price is the main factor affecting how much producers are willing to supply, several other important factors can influence supply decisions. These non-price factors can shift the entire supply curve:
Natural factors
Weather conditions and natural disasters play a crucial role, especially in agricultural markets.
Natural factors are particularly important because they're completely outside human control, yet they can dramatically affect market supply and prices.
Examples include:
- Droughts, hail, or floods can significantly reduce the supply of crops
- Favourable weather conditions and large harvests can increase supply
- These factors are beyond human control but have major market impacts
Production costs
When it becomes more expensive to produce goods, suppliers may reduce the amount they're willing to supply at each price level. Conversely, if production costs fall, suppliers can afford to supply more. Changes in production costs can come from:
- Raw material price changes
- Labour cost variations
- Energy price fluctuations
- Rent and facility costs
Technological improvements
Advances in technology generally make production more efficient and cheaper. When new technology allows producers to make goods more cheaply, they can supply more at the same price levels, or the same amount at lower prices.
Market competition
The number of producers in the market affects overall supply:
- When new producers enter the market, total supply increases
- When existing producers leave the market, total supply decreases
Movements versus shifts
Understanding the difference between movements and shifts is crucial for economics success and is often tested in examinations.
Movement along the curve: When only the price changes, we see a movement along the existing supply curve. The curve itself doesn't change position - we simply move to a different point on the same curve.
Shift of the curve: When any of the non-price factors (natural conditions, production costs, technology, or number of producers) change, the entire supply curve shifts to a new position.
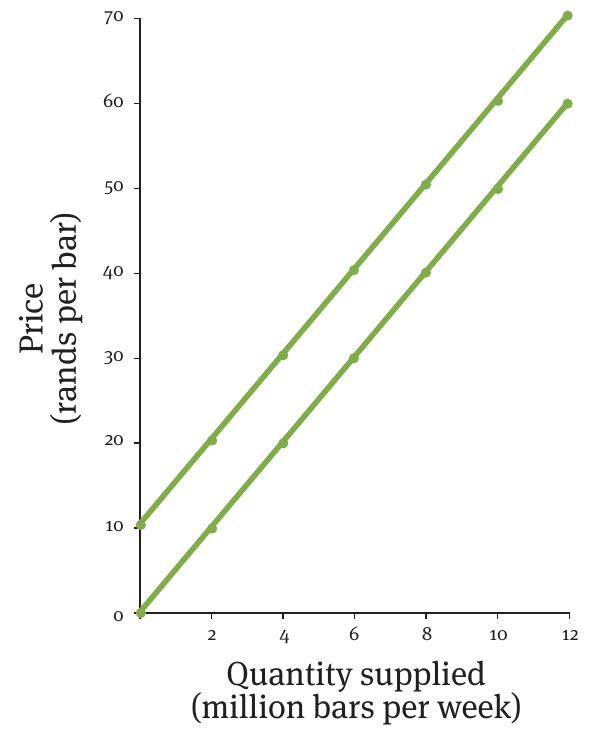
This diagram shows two supply curves. The shift from one curve to another represents a change in supply conditions due to non-price factors. Both curves maintain the same upward slope, but one is positioned differently from the other.
Key Points to Remember:
- Supply is the quantity producers are willing to offer at different price levels
- The law of supply states that higher prices lead to higher quantities supplied
- The supply curve slopes upward, showing the positive price-quantity relationship
- Non-price factors like weather, costs, technology, and competition can shift the entire supply curve
- Price changes cause movements along the curve, while other factors cause shifts of the curve