Collecting Information About the Weather (Grade 10 NSC Matric Geography): Revision Notes
Collecting Information About the Weather
Weather information is essential for understanding geographical processes and patterns. Geographers use various methods to collect weather data through both practical work and fieldwork activities. This information helps us understand climate patterns, make predictions, and study environmental changes.
What is fieldwork and practical work?
Fieldwork refers to geographical investigations conducted outside the classroom environment. This hands-on approach allows you to gather real-world data and observe geographical processes directly. Fieldwork activities might include conducting surveys, creating sketches and maps, measuring and recording data, or interviewing local people about their experiences.
Practical work involves conducting experiments, making careful observations, and reporting your findings. Both approaches help you discover more about geographical processes through direct experience rather than just reading about them.
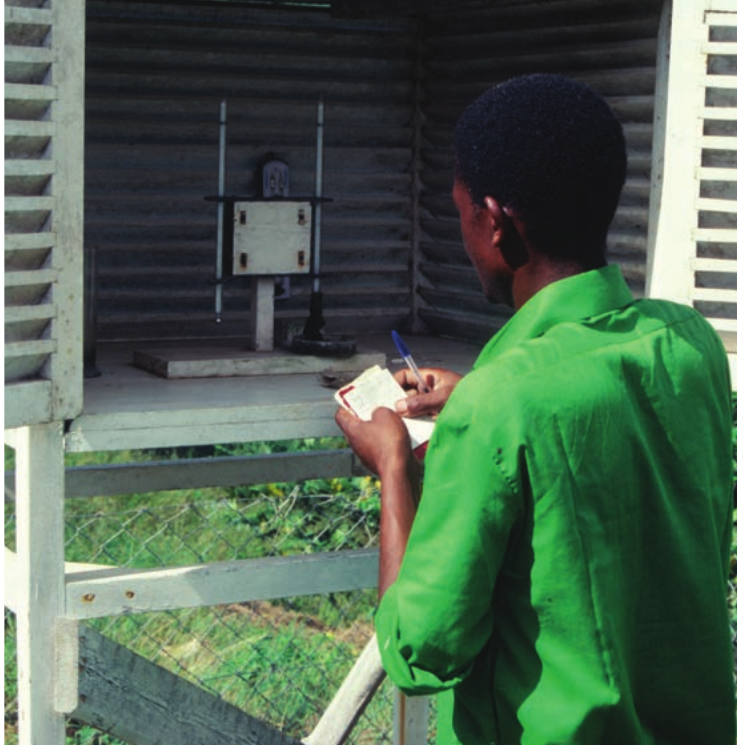
Fieldwork requires careful observation and systematic data recording, as shown by this researcher taking detailed notes during an outdoor investigation.
Methods of collecting weather information
There are several effective ways to gather weather data for geographical studies:
Finding information in the media
Newspapers, television weather broadcasts, and online weather services provide readily accessible weather information. These sources often include detailed forecasts, current conditions, and historical weather data that can be useful for geographical analysis.
Using weather instruments
Direct measurement using specialised weather instruments provides accurate, real-time data. These instruments can measure temperature, rainfall, wind speed, humidity, and atmospheric pressure. Schools and weather stations use these tools to collect precise meteorological data.
Using special organisations
Professional meteorological services like the South African Weather Service provide comprehensive weather data, satellite images, and expert analysis. These organisations maintain extensive databases and offer detailed forecasting services that geographers can access for research purposes.
Understanding weather maps
Weather maps are visual representations that display various meteorological conditions across different geographical areas. These maps combine multiple data sources to show current weather patterns and forecasts.
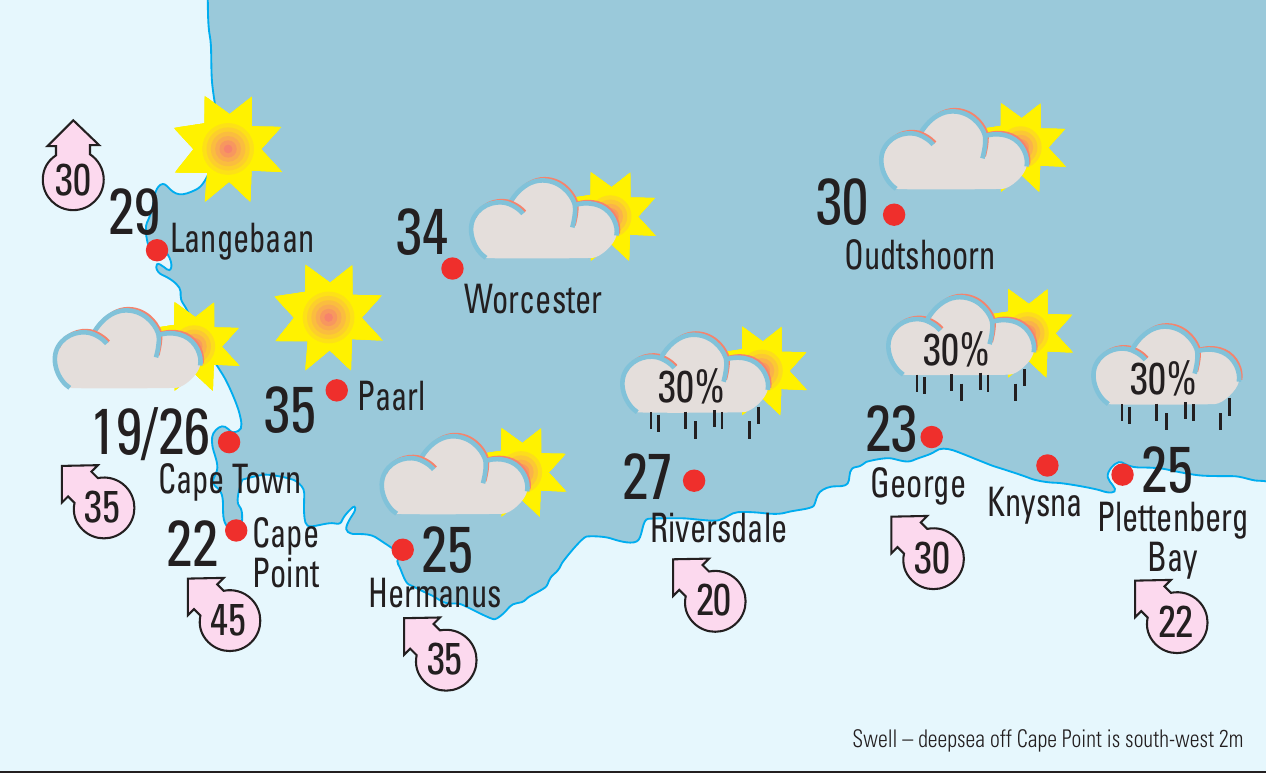
Weather Map Analysis: Western Cape Forecast
This weather forecast map of the Western Cape demonstrates how meteorological information is presented visually. The map includes several key elements that help us interpret weather conditions and make informed decisions.
Key features of weather maps
- Temperature readings: Shows both maximum and minimum expected temperatures for different locations
- Weather symbols: Icons representing sunny conditions, cloud cover, or precipitation
- Precipitation probability: Percentage chances of rainfall (like the 30% shown for some areas)
- Wind information: Direction and speed indicators
- Cloud cover: Visual representation of expected cloud conditions
Weather maps help geographers identify patterns, compare conditions across regions, and understand how weather systems move and develop.
Using maximum and minimum thermometers
Temperature measurement is crucial for weather data collection. Maximum and minimum thermometers are specialised instruments designed to record the highest and lowest temperatures reached during a specific period, usually 24 hours.
How max-min thermometers work
These thermometers contain two separate measuring tubes:
- Maximum tube: Records the highest temperature reached
- Minimum tube: Records the lowest temperature reached
The instrument uses markers that remain at the extreme temperature positions until manually reset. This allows researchers to record daily temperature ranges even when they cannot monitor the thermometer continuously.
Key components
- Spirit: The liquid that expands and contracts with temperature changes
- Markers: Indicators that show maximum and minimum readings
- Mercury: Used in some thermometer designs for accurate measurement
- Magnet: Used to reset the markers for new measurement periods
Why temperature ranges matter
Understanding daily temperature variation is important because:
- Agricultural planning: Farmers need to know temperature extremes to protect crops
- Tourism industry: Visitors want to know what temperatures to expect
- Climate research: Long-term temperature patterns help scientists understand climate change
- Daily planning: People use this information to decide what clothing to wear
Practical applications
Weather information collection serves various important purposes in geography and beyond:
Research applications
- Studying climate patterns and changes over time
- Understanding relationships between weather and human activities
- Investigating how geographical features influence local weather
- Comparing weather conditions across different regions
Real-world uses
- Supporting agricultural decision-making
- Assisting tourism and recreational planning
- Contributing to climate change research
- Helping communities prepare for weather events
Key Points to Remember:
- Fieldwork and practical work provide hands-on experience with geographical processes outside the traditional classroom setting
- Multiple sources of weather information include media reports, direct instrument measurements, and professional meteorological services
- Weather maps combine various data types to show temperature, precipitation, wind, and cloud conditions across geographical areas
- Maximum and minimum thermometers use specialised markers to record temperature extremes over 24-hour periods
- Temperature data serves important purposes for agriculture, tourism, research, and daily planning activities