GIS Concepts Explained (Grade 10 NSC Matric Geography): Revision Notes
GIS Concepts Explained
Geographic Information Systems (GIS) are powerful digital tools that help us store, analyse, and display geographic data. Understanding how GIS works requires knowledge of its main components and how they work together to solve real-world problems.
GIS technology has revolutionized how we work with geographic information, transforming traditional paper maps into dynamic digital tools that can be updated, analyzed, and customized for specific needs.
The four components of GIS
To operate any GIS successfully, you need four essential components working together. These are hardware, software, data, and personnel. Think of these as the building blocks that make GIS possible.
Remember the acronym HDSP - Hardware, Data, Software, Personnel. All four components must work together for GIS to function effectively. Missing any one component will prevent the system from operating properly.
Hardware
Hardware includes all the physical equipment used to collect, store, and display geographic information. Modern GIS relies on various types of technology to function effectively.
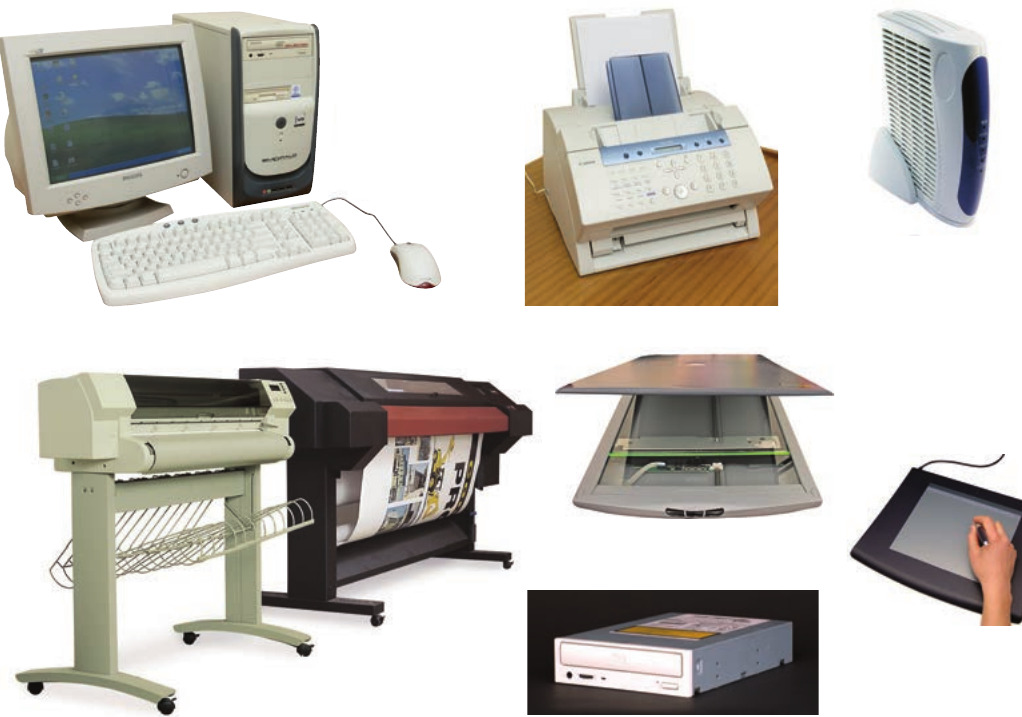
Essential GIS hardware includes:
- Computers - the main processing units that run GIS software
- Printers and plotters - devices that produce paper maps and charts
- Scanners - equipment that converts paper maps into digital format
- GPS devices - tools that collect precise location data in the field
- Digitising tablets - specialised input devices for tracing maps and entering spatial data
Software
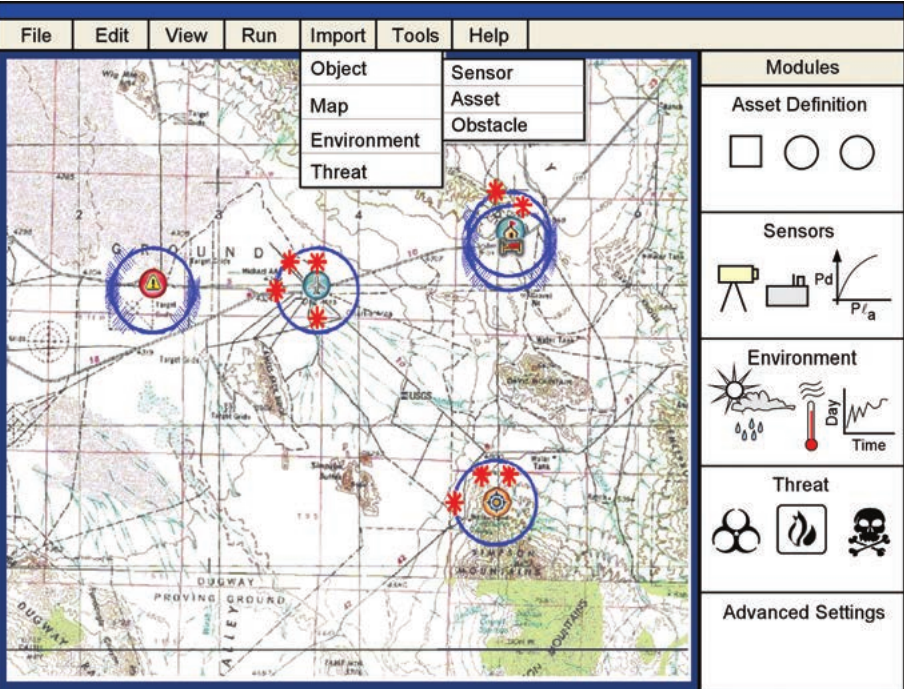
Software refers to the computer programs that store, manipulate, and analyse geographic data. These programs are the "brain" of any GIS operation, controlling how data is processed and displayed.
Popular GIS software includes programs like IDRISI, ArcGIS, IMAP, Google Earth, PlanetGIS, and QGIS. Each software package offers different tools and capabilities for working with geographic information.
Data
Data forms the foundation of any GIS and represents the information we use to model real-world features. All GIS data is geographically referenced, meaning it's connected to specific coordinates on Earth's surface through latitude and longitude.
Understanding the Two Types of GIS Data:
GIS data is always geographically referenced, but it comes in two distinct forms that serve different purposes in mapping and analysis.
GIS uses two main types of data:
Spatial data describes the shape and location of geographic features. This information appears as graphical representations on maps, showing us where things are located and what they look like.
Attribute data provides additional descriptive information about spatial features. This data is stored "behind the scenes" in databases and can be accessed by clicking on map features. For example, clicking on a school symbol might reveal information about student numbers, facilities, or performance statistics.
Personnel
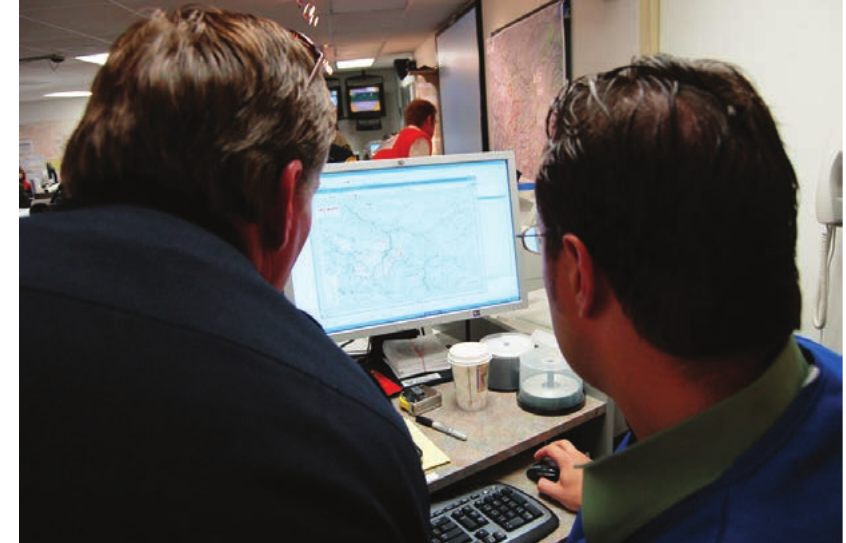
Personnel are the people who make GIS work. Different specialists contribute their expertise to ensure GIS systems operate effectively:
- Program designers - IT specialists who create and maintain GIS software
- GIS specialists - technicians who apply GIS technology across different fields of study
- Users - people who use GIS in their work to gather information and solve problems
Data capture in GIS
Getting information into a GIS requires careful data collection from various sources. This process is called data capture and involves gathering both spatial and attribute information.
Capturing spatial data
Digital maps used in GIS come from multiple sources, each offering different advantages:
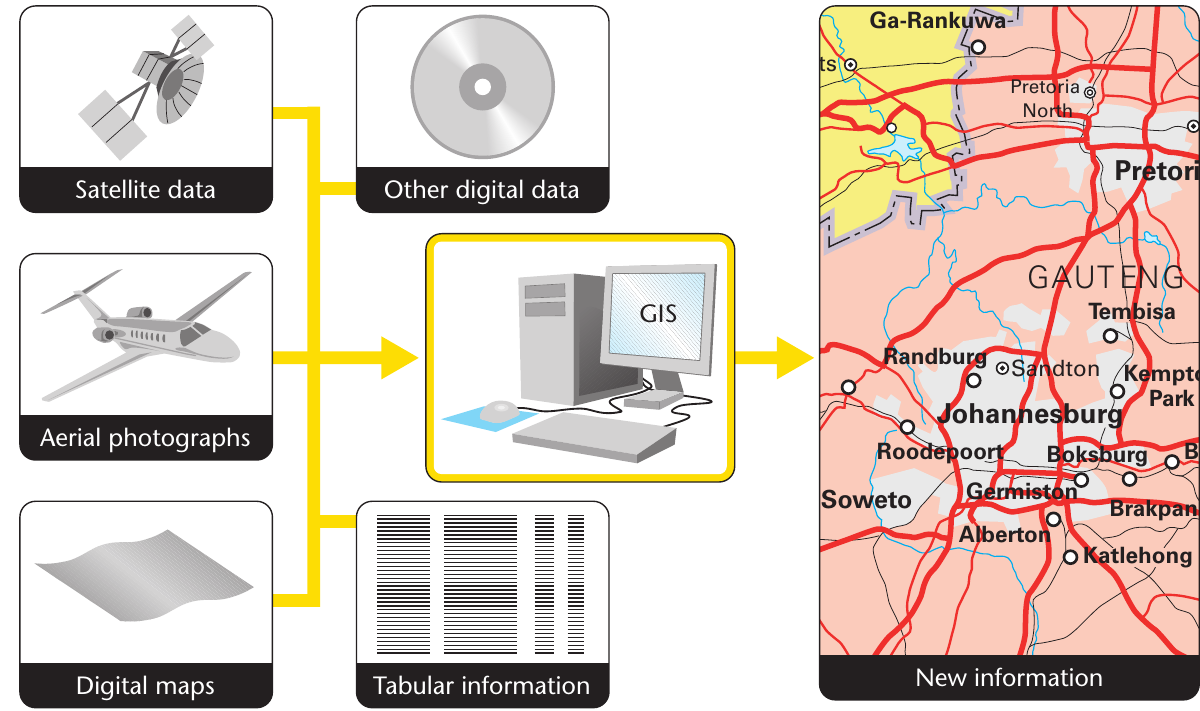
- Traditional printed maps - existing paper maps that can be scanned and digitised
- Satellite images - high-resolution photographs taken from space
- Aerial photographs - pictures taken from aircraft flying over the study area
Modern GIS systems excel at data integration - they can combine information from traditional maps, satellite imagery, and aerial photography to create comprehensive digital maps that are more detailed and accurate than any single source alone.
Capturing attribute data
Attribute information comes from existing databases that contain geographically referenced data. Examples include census data linked to specific households, government department records, and survey results collected through fieldwork.
A Global Positioning System (GPS) device helps ensure that collected information can be accurately positioned on digital maps. GPS uses satellite technology to determine precise coordinates anywhere on Earth's surface.
Data storage formats
GIS stores geographic information using two main formats: vector and raster. Understanding these formats helps explain how digital maps represent real-world features.
Vector vs Raster: Think of the Difference
- Vector format = like drawing with precise lines and shapes (clean, mathematical)
- Raster format = like a digital photograph made of tiny squares (pixelated, grid-based)
Choose vector for precise boundaries and measurements, choose raster for continuous data like temperature or elevation.
Vector format
Vector format represents geographic features using points, lines, and polygons. This approach creates clean, precise digital maps that closely resemble traditional printed maps.
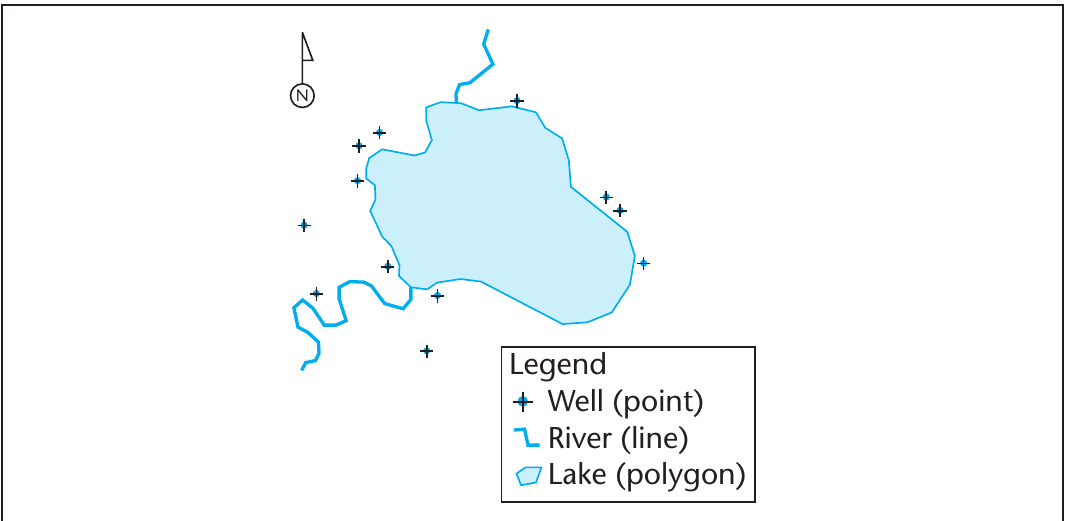
- Points have single coordinate locations and represent features with limited extent, such as wells, schools, or cities
- Lines connect multiple points together to represent linear features like roads, rivers, or boundaries
- Polygons are enclosed areas that represent features like lakes, parks, or administrative regions
The beginning and end points of lines are called nodes, which help define the precise shape and connection of linear features.
Worked Example: Vector Feature Types
Imagine mapping your school:
- Point: The main office location (single coordinate)
- Line: The fence around the school perimeter (connected coordinates)
- Polygon: The sports field area (enclosed boundary with defined area)
Each feature type is chosen based on how the real-world object is best represented at the map scale being used.
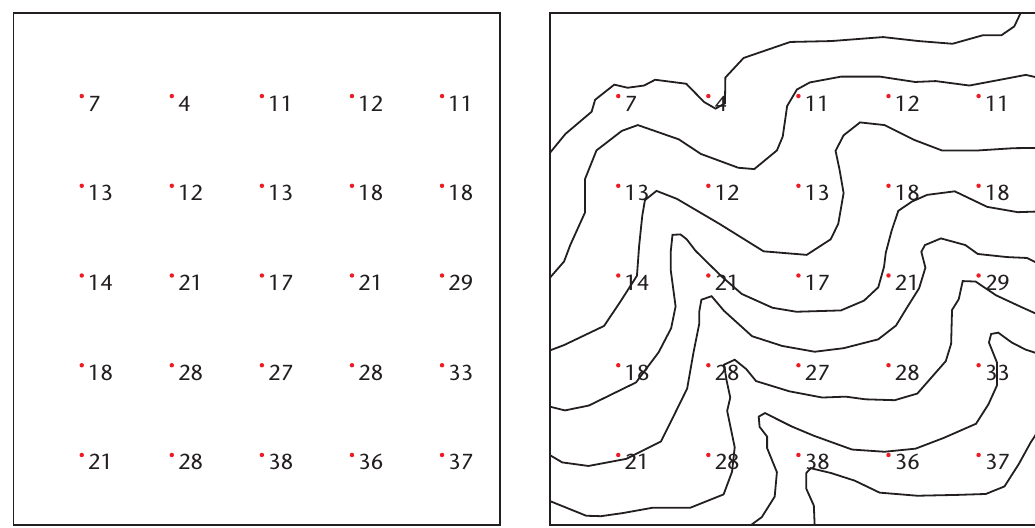
Raster format
Raster format stores geographic information as a grid of cells, similar to a digital photograph. Each cell (called a pixel) contains a single value describing the feature it represents.
Raster maps look more like pixelated images than traditional maps. Groups of pixels sharing the same value combine to represent larger features like forests, urban areas, or water bodies. Individual pixels might represent specific features such as well locations.
Think of raster data like a digital camera image - zoom in far enough and you'll see the individual squares (pixels) that make up the picture. Each pixel stores one piece of information about that location.
Advantages of GIS
GIS technology offers numerous benefits for manipulating geographic information and solving spatial problems:
Data integration capabilities:
- Capture and link digital information from multiple sources
- Convert geographically-referenced data into map format
- Change between different map projections as needed
Analysis and visualisation tools:
- Adjust map scales from detailed local views to broad regional overviews
- Select and layer maps showing different variables
- Build customised maps displaying only required information
- Access detailed attribute data for any map feature
Dynamic updating and modelling:
- Update maps instantly as new events occur
- Map emergency situations like floods for disaster planning
- Perform sophisticated calculations, modelling, and predictions using computer software
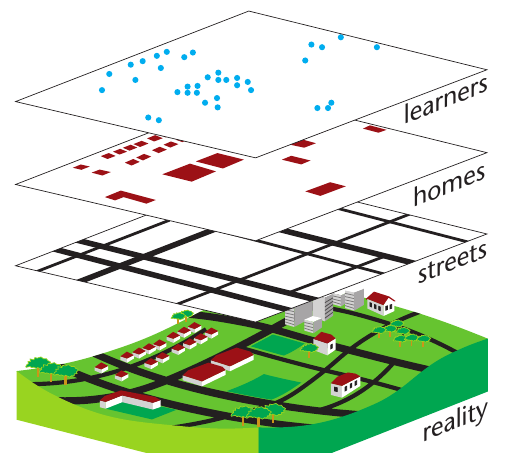
Overlay analysis:
- Combine multiple thematic map layers to reveal new patterns
- Each layer shows one variable, allowing complex spatial analysis
- Create new maps by overlaying different data themes
Overlay analysis is one of GIS's most powerful features - imagine stacking transparent maps on top of each other to see how different factors (like population density, rainfall, and soil type) relate to each other geographically.
GIS transforms how we understand and interact with geographic information, making it easier to visualise complex spatial relationships and make informed decisions based on location-based data.
Key Points to Remember:
- GIS needs four components - hardware, software, data, and personnel must all work together
- Two data types matter - spatial data shows location and shape, while attribute data provides additional descriptive information
- Vector uses points, lines, polygons - creates clean maps similar to traditional printed versions
- Raster uses pixels in grids - stores data like a digital photograph with individual cell values
- GIS enables powerful analysis - combines multiple data sources and creates custom maps for decision-making