Topographic Maps (Grade 10 NSC Matric Geography): Revision Notes
Landforms and Contours
What are landforms and relief?
Landforms are the natural features that make up Earth's surface. They develop over time as rock structures are shaped by erosion from wind, water, and ice. These forces gradually sculpt the landscape into different shapes like hills, valleys, ridges, and plateaus. When erosion removes material from one area, it often deposits it somewhere else, creating new landforms in the process.
The overall shape of the land surface in any area is called the relief or topography. Understanding relief is essential for reading topographic maps and recognising different landscape features.
Relief and topography are interchangeable terms that both refer to the three-dimensional shape of Earth's surface. This concept is fundamental to understanding how landscapes are represented on flat maps.
How contour lines show landforms on maps
Topographic maps use contour lines to show the three-dimensional shape of the land on a flat piece of paper. These lines are one of the most important tools for understanding landscapes from maps.
Key definitions you need to know
Essential Vocabulary for Map Reading:
- Contour line: A line on a map that connects all places with the same height above sea level
- Contour interval: The difference in height between one contour line and the next (usually 20 metres on South African maps)
- Index contour: Bold contour lines that appear every fifth line, representing intervals of 100 metres
- Spot height: A precise elevation point marked on the map
- Benchmark: A physical marker showing exact altitude, represented by an arrow symbol
- Trigonometrical station: Accurately surveyed points used for mapping, shown as concrete structures
Important characteristics of contour lines
Understanding how contour lines behave will help you read any topographic map accurately:
Critical Contour Line Rules:
- They never cross each other - Each line represents a specific height
- They are continuous lines - They form complete loops, even if the loop extends beyond the map edge
- They never end - Unless they reach the edge of the map
- Spacing shows gradient - The distance between contour lines tells you about slope steepness
- Number values indicate height - The orientation of numbers shows whether contours represent higher or lower areas
Recognising landforms from contour patterns
Each type of landform creates a distinctive pattern of contour lines. Learning these patterns will help you identify landscape features quickly and accurately.
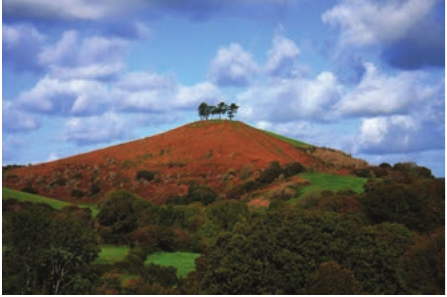
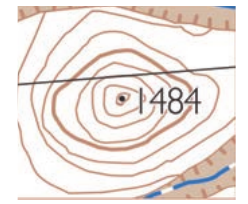
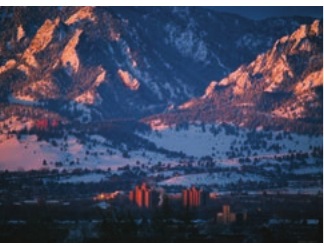
Hills and mountains
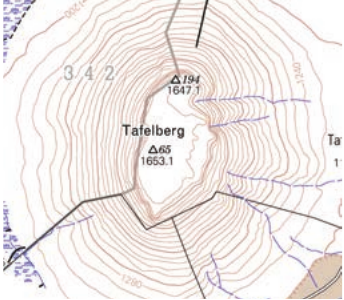
Conical hills appear as concentric circles on maps, with the highest point at the centre. The circles get smaller as you move toward the peak. Table Mountain in Cape Town is a famous example of how mountains appear both on maps and in reality.
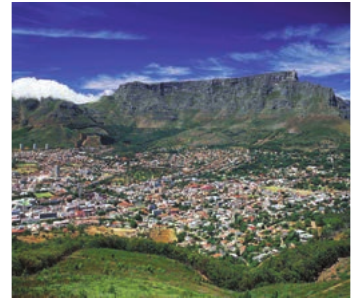
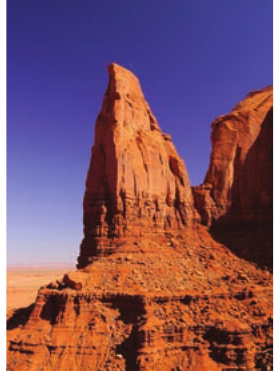
Mesas are flat-topped mountains where the width is greater than the height. Their contour lines form oval or circular patterns with a flat central area.
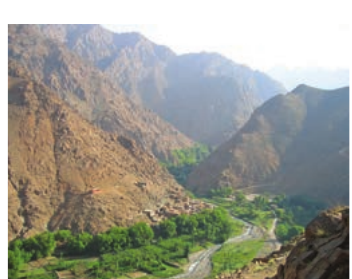
Valleys and water features
Valleys create V-shaped contour patterns that point upstream toward higher ground. The apex of the V always points toward the source of water flow. Rivers typically flow through the bottom of valleys.
Valley Recognition Tip: Remember that V-shaped contours always point uphill - toward the source of the water that carved the valley.
Spurs are raised areas between adjacent valleys, also creating V-shaped contours, but pointing downhill toward lower areas.
Ridges and linear features
Ridges appear as elongated high areas with contour lines running parallel to the ridge line. They often connect different peaks or high points.
Passes are low points along ridges where roads or rivers can cross between valleys. The contour lines show a saddle-like depression in the ridge.
Plateaus and escarpments
Plateaus are large, flat, elevated areas shown by widely spaced contour lines at high elevations.
Escarpments are steep edges of plateaus, indicated by very closely spaced contour lines forming the boundary between the plateau and lower ground.
Understanding slopes through contour spacing
The spacing between contour lines reveals crucial information about the steepness of slopes. This relationship is fundamental to reading topographic maps effectively.
The Golden Rule of Contour Reading: Close contour lines = steep slopes Wide contour spacing = gentle slopes
This relationship never changes and is essential for interpreting any topographic map.
Types of slopes
Uniform slopes maintain constant gradient, shown by evenly spaced contour lines that remain the same distance apart.
Steep slopes have contour lines very close together. When lines touch or nearly touch, they indicate cliffs or very steep terrain.
Gentle slopes show widely spaced contour lines, indicating nearly level or gradually sloping terrain.
Concave slopes start steep at the top and become gentler toward the bottom. Contour lines are close together at higher elevations and spread out lower down.
Convex slopes begin gently and become steeper toward the bottom. Contour lines start far apart and get closer together at lower elevations.
Terraced slopes show alternating steep and gentle sections, often created by human activity like farming or natural processes.
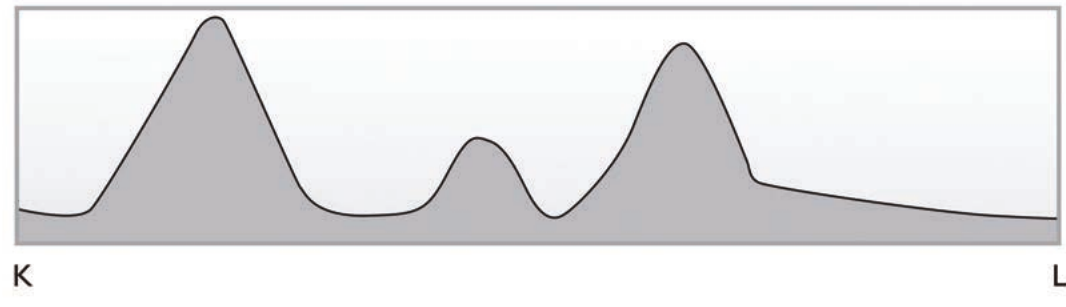
Cross-sections: seeing the landscape from the side
A cross-section provides a side view or profile of landscape features. It's like cutting through the land with a giant knife and looking at the exposed edge. Cross-sections help you visualise what the terrain would look like if you were walking across it.
Creating cross-sections
Cross-sections are constructed by plotting elevation points along a straight line drawn across a topographic map. The process involves:
Step-by-Step Cross-Section Construction:
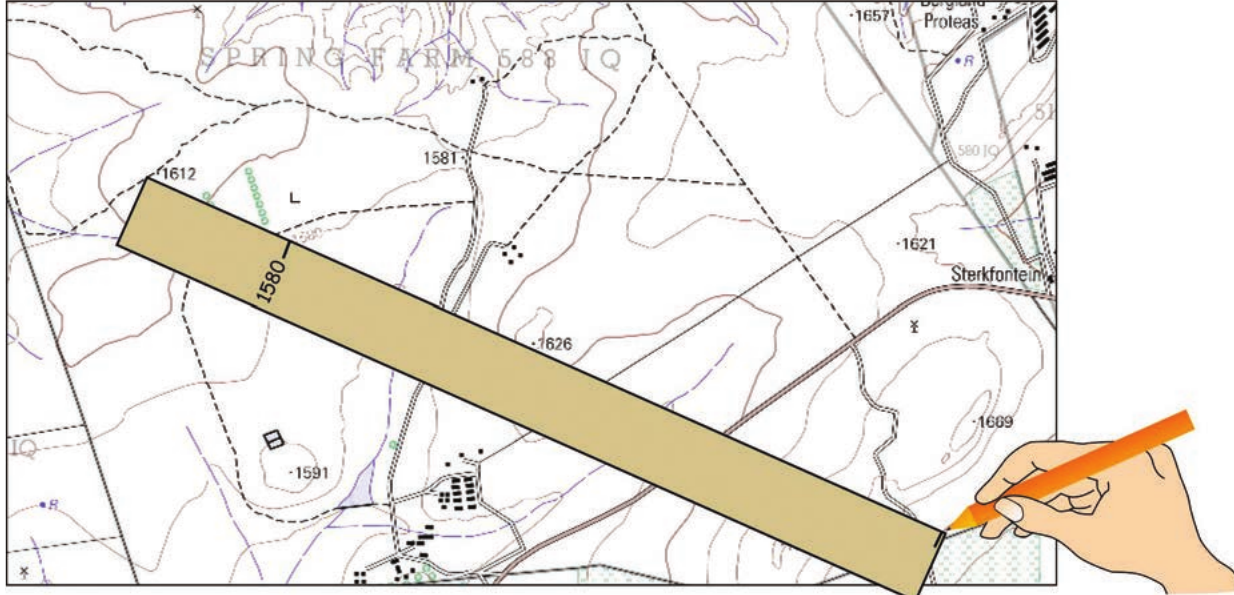
- Drawing a line between two points on the map
- Marking where contour lines cross this line
- Recording the elevation of each contour line
- Plotting these elevations on a graph
- Connecting the points to show the land profile
Cross-sections can be simple sketches that show general topography or detailed technical drawings that include precise measurements, settlements, and human-made features.
Exam tips for working with contours
Essential Exam Strategies:
- Practice identifying landforms by their contour patterns - this is a common exam question
- Remember the relationship between spacing and gradient - closer lines always mean steeper slopes
- Pay attention to contour line values - they tell you whether you're looking at hills or depressions
- Use the contour interval to calculate height differences between features
- Look for index contours to quickly identify major elevation changes
Key Points to Remember:
- Contour lines connect points of equal elevation and never cross each other
- Close contour spacing indicates steep slopes while wide spacing shows gentle terrain
- Different landforms create distinctive contour patterns that you can learn to recognise
- Cross-sections provide side views of terrain by plotting elevation changes along a line
- The contour interval on South African maps is typically 20 metres with index contours every 100 metres