Using Atlases (Grade 10 NSC Matric Geography): Revision Notes
The Kinds of Maps in an Atlas
What is an atlas?
An atlas is a book of maps that serves as one of the most important geography textbooks available. Rather than just reading about different places around the world, an atlas allows you to visualise countries, continents, and various geographical features through detailed maps. This visual approach often makes information clearer and easier to understand than lengthy written descriptions.
The visual nature of atlases makes them particularly valuable for geography students. When you can see geographical patterns and relationships on maps, complex concepts become much easier to understand and remember than when described only in text.
Atlases contain many different types of maps, each designed to show specific kinds of geographical information. Understanding the various types of maps in an atlas will help you extract the most useful information for your studies.
Types of maps found in atlases
Political maps
Political maps focus on showing the boundaries between countries, states, provinces, and other administrative divisions. These maps use different colours to distinguish between nations and clearly label country names, capital cities, and major urban centres.
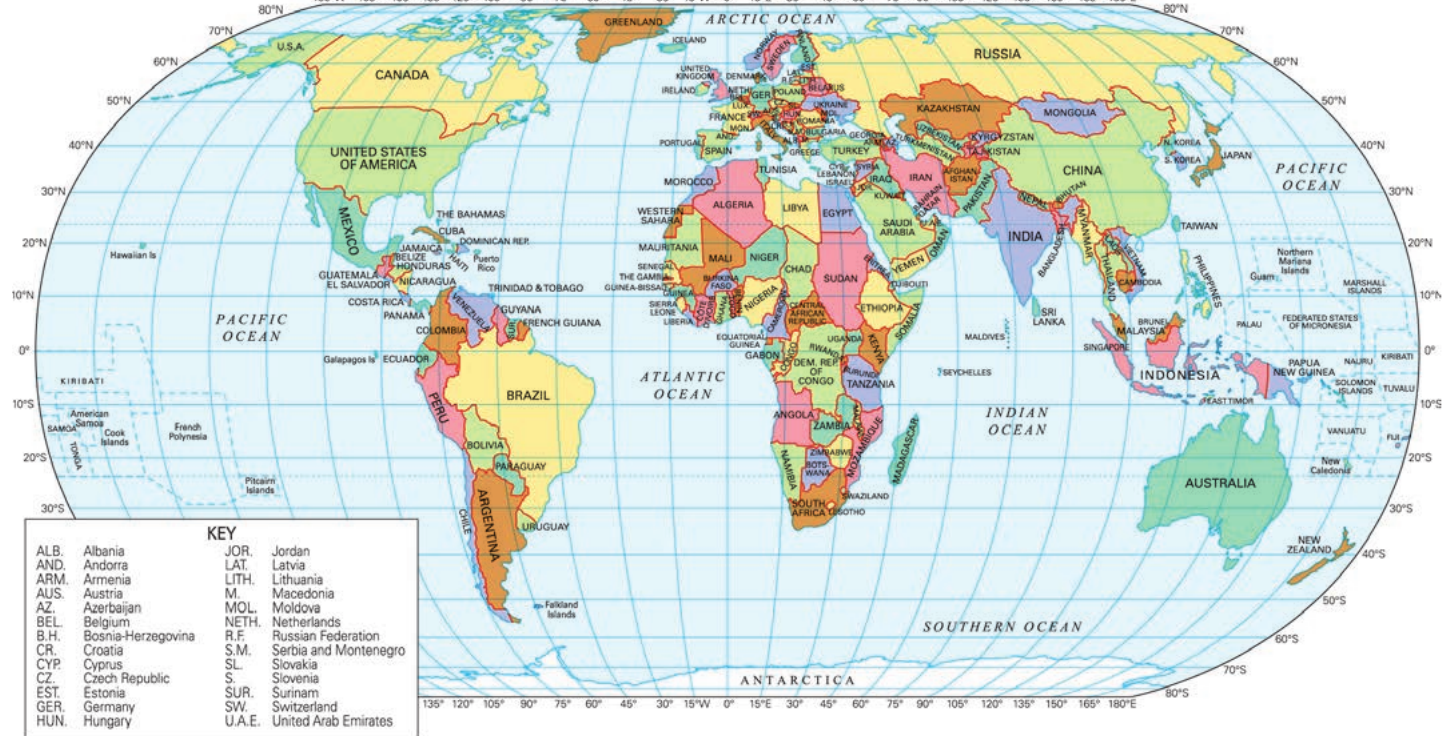
Political maps are particularly useful when you need to:
- Identify countries and their locations
- Understand international boundaries
- Locate capital cities and major urban areas
- Study the political divisions of continents
The colour-coding system on political maps is crucial for quick identification. Each country is typically shown in a different colour from its neighbours, making borders immediately visible and helping prevent confusion between adjacent nations.
Physical and climate maps
Climate maps display information about weather patterns, temperature zones, and climatic conditions across different regions of the world. These maps use colour-coding systems to show variations in climate types, making it easy to identify patterns and compare different areas.
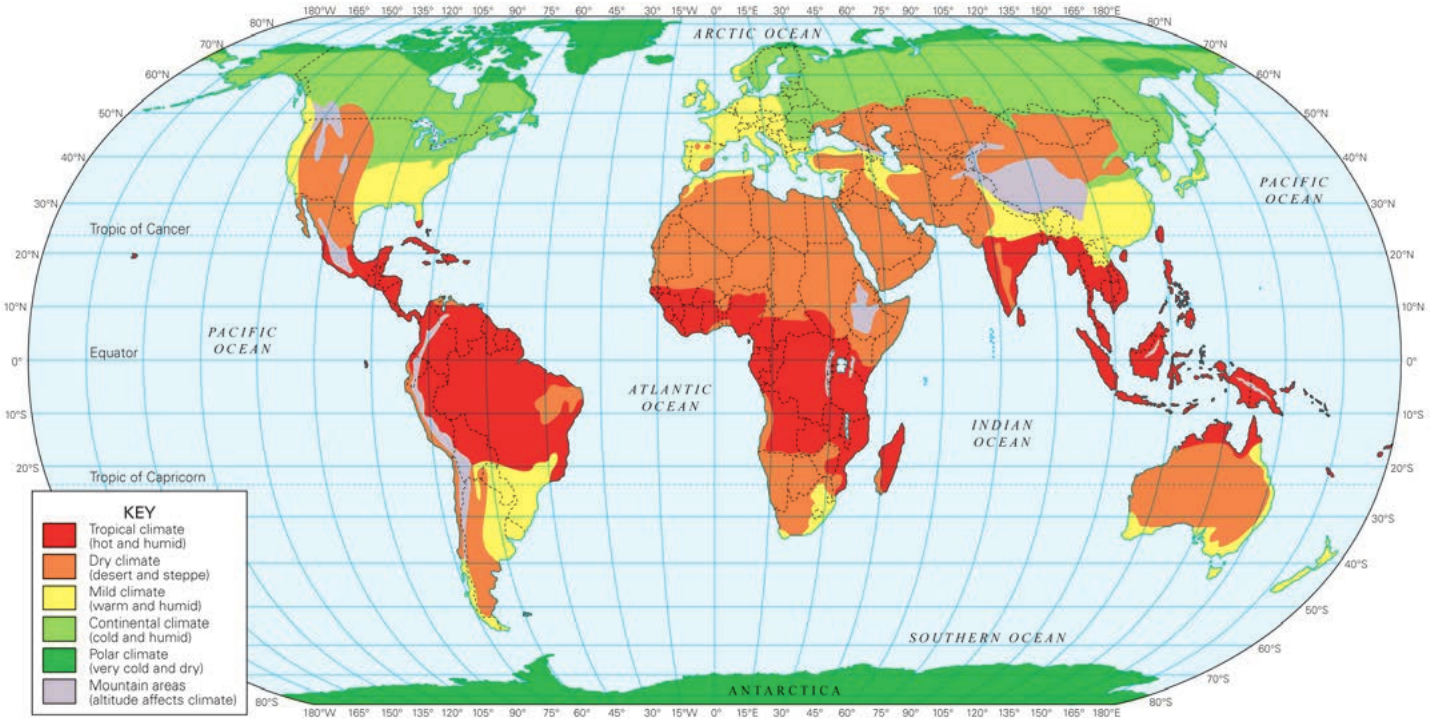
The world climate map shown above uses different colours to represent various climate zones:
- Red areas: Tropical climates (hot and humid)
- Orange areas: Dry climates (desert and steppe regions)
- Yellow areas: Mild climates (warm and humid)
- Green areas: Continental and polar climates (cold regions)
- Purple areas: Mountain regions where altitude affects climate
Vegetation maps
Vegetation maps show the natural plant communities and biomes found in different parts of the world. These maps help geographers understand the relationship between climate, soil conditions, and the types of plants that grow in various regions.
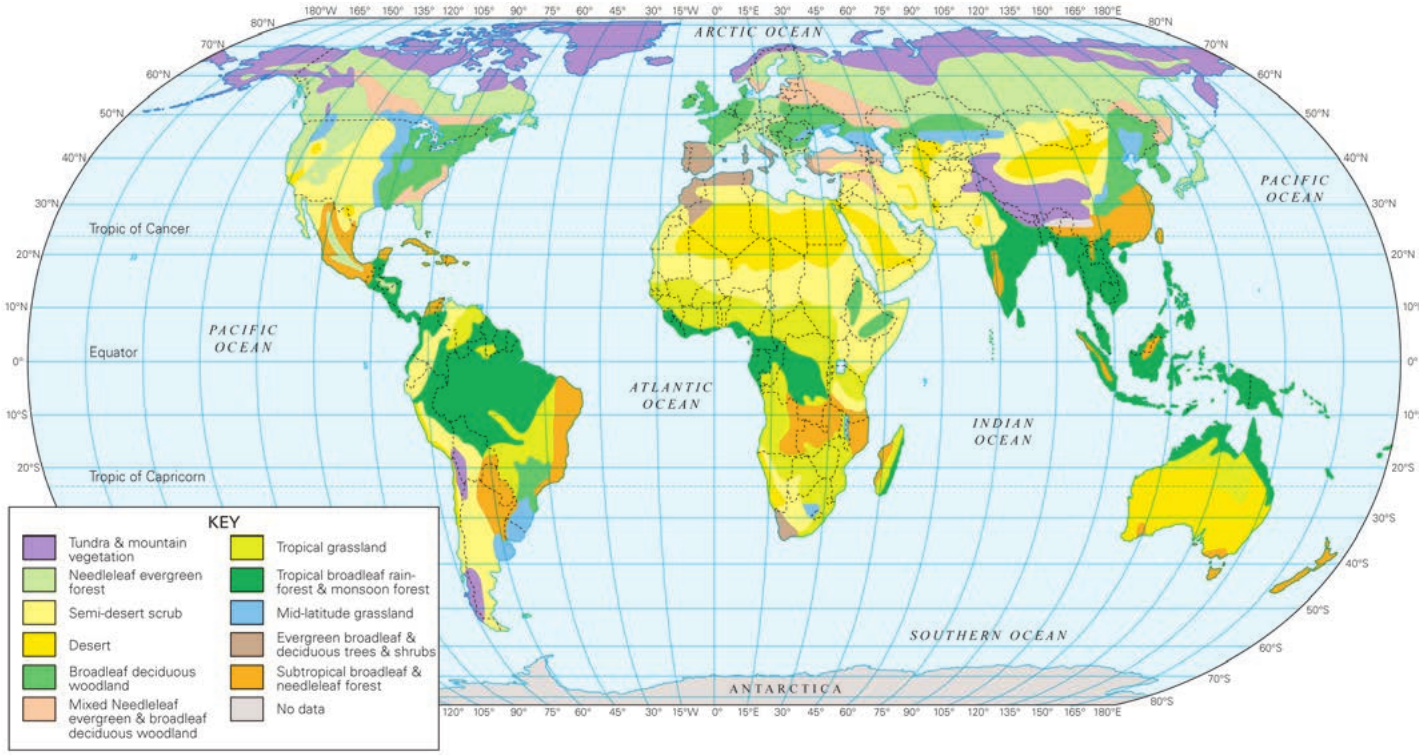
Vegetation maps typically display:
- Tropical rainforests: Dense, evergreen forests in hot, humid areas
- Grasslands: Areas dominated by grasses rather than trees
- Deserts: Regions with minimal plant life due to lack of water
- Deciduous forests: Areas with trees that lose their leaves seasonally
- Tundra: Cold regions with limited plant growth
Notice how vegetation patterns closely match climate zones. This relationship helps explain why certain plants grow in specific regions and how environmental factors influence natural ecosystems.
Thematic maps
Thematic maps are specialised maps that focus on a particular theme or topic connected with a specific geographic area. Unlike general maps that show multiple types of information, thematic maps concentrate on one specific aspect such as population density, economic activities, natural resources, or climate patterns.
Definition: A thematic map is a map that shows information on a particular theme or topic connected with a specific geographic area. This focused approach allows for detailed analysis of specific geographical patterns and relationships.
South African thematic map examples
Thematic maps are particularly valuable for studying detailed patterns within specific countries or regions. The following examples demonstrate how thematic maps can reveal important information about South Africa's climate patterns and help geographers understand regional variations.
Temperature maps
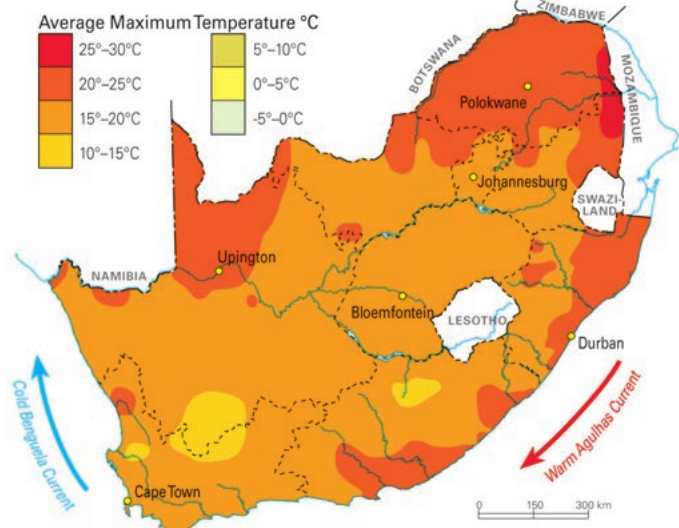
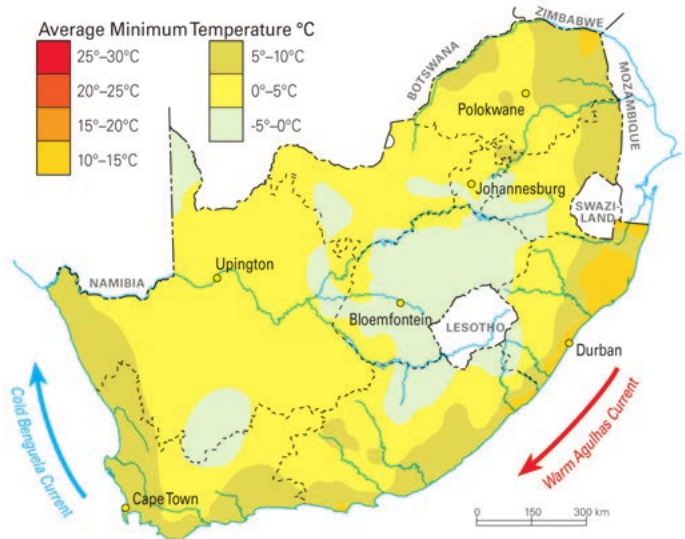
These temperature maps of South Africa show:
- Maximum temperatures: The hottest temperatures reached during different seasons
- Minimum temperatures: The coolest temperatures experienced
- Seasonal variations: How temperatures change between winter and summer
- Regional patterns: Which areas of the country are consistently warmer or cooler
Rainfall maps
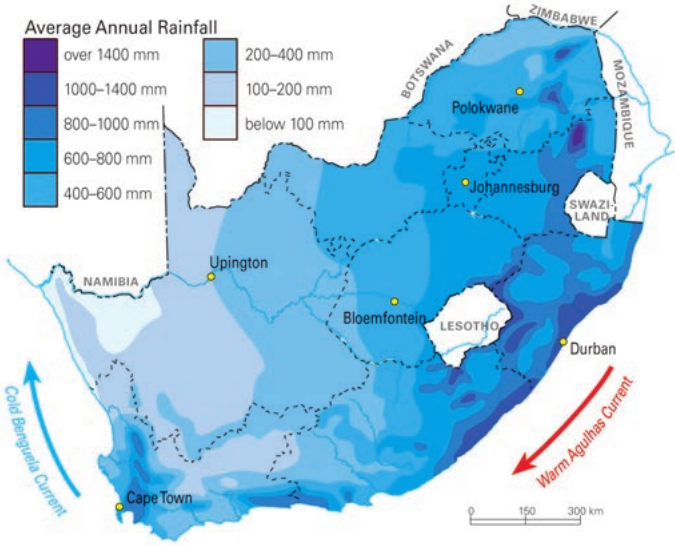
Rainfall maps demonstrate precipitation patterns across South Africa, showing:
- Areas receiving high annual rainfall (over 1000mm per year)
- Dry regions with minimal precipitation (less than 200mm per year)
- Seasonal rainfall patterns
- The influence of geographical features on precipitation
Worked Example: Interpreting South African Climate Patterns
Step 1: Examine the temperature maps to identify the warmest and coolest regions
- Coastal areas tend to have more moderate temperatures
- Interior regions show greater temperature extremes
Step 2: Compare with rainfall patterns
- Eastern regions typically receive higher rainfall
- Western areas are generally drier
Step 3: Connect the patterns
- The combination reveals why certain areas are suitable for different types of agriculture and vegetation
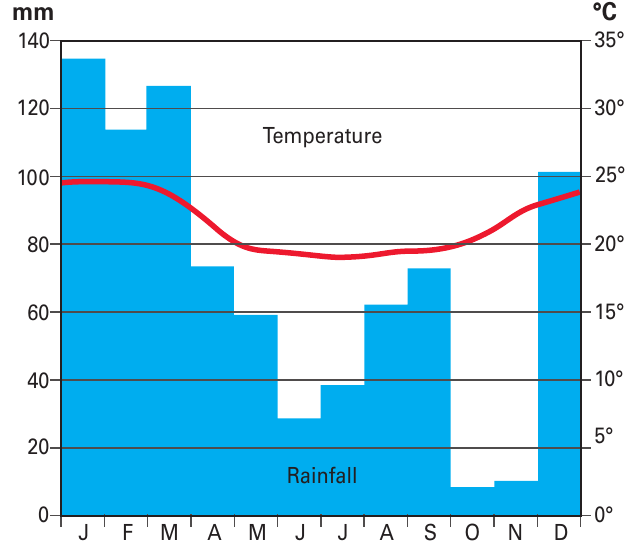
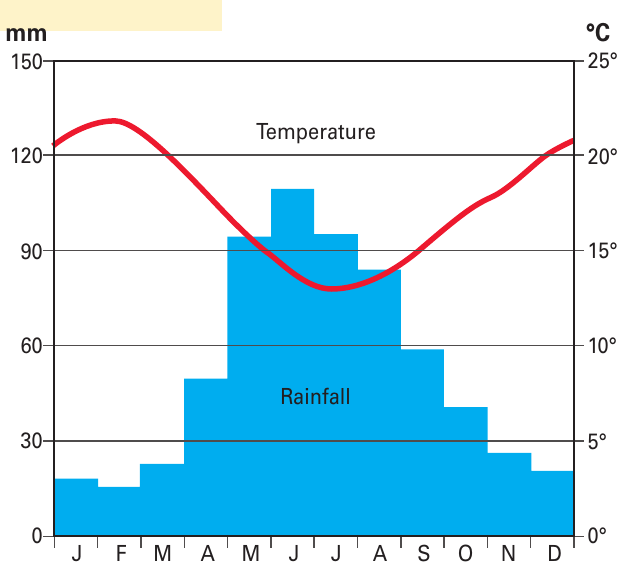
Reading climate graphs
Climate graphs (also called climatographs) are special diagrams that appear in atlases to show both temperature and rainfall information for specific locations throughout the year. These graphs combine two types of data:
- Blue bars: Represent monthly rainfall amounts (measured in millimetres)
- Red line: Shows monthly temperature variations (measured in degrees Celsius)
How to interpret climate graphs
Understanding climate graphs is essential for analysing regional weather patterns and climate characteristics.
Worked Example: Reading a Climate Graph
Step 1: Examine the rainfall pattern Look at the height of the blue bars to identify wet and dry seasons
Step 2: Study the temperature line Follow the red line to understand seasonal temperature changes
Step 3: Identify climate type Use both patterns together to determine the climate characteristics
Step 4: Compare seasonal relationships Notice whether the wettest months correspond to the warmest or coolest temperatures
Key patterns to recognise
- Winter rainfall climates: High precipitation during cooler months
- Summer rainfall climates: Maximum precipitation during warmer periods
- Tropical climates: Consistently warm temperatures with distinct wet and dry seasons
- Temperate climates: Clear seasonal temperature variations with moderate rainfall
Benefits of using atlas maps
Different types of atlas maps serve various purposes in geographical study. Understanding these benefits helps you choose the most appropriate map type for your research needs.
Atlas maps provide several key advantages:
- Comparison: Maps allow you to compare patterns between different regions quickly
- Pattern recognition: Visual representations make it easier to identify geographical trends
- Spatial relationships: Maps show how different factors (like climate and vegetation) relate to each other geographically
- Data presentation: Complex numerical information becomes more accessible when displayed visually
The visual nature of maps makes them particularly effective for identifying relationships that might not be obvious from statistical data alone. For example, seeing how mountain ranges influence rainfall patterns is much clearer on a map than in a table of numbers.
Key Points to Remember:
- An atlas is a collection of maps that makes geographical information visual and accessible
- Political maps show countries, boundaries, and administrative divisions using different colours
- Climate maps display weather patterns and temperature zones across regions using colour-coded systems
- Vegetation maps reveal the types of plant communities found in different areas based on climate and environmental conditions
- Thematic maps focus on specific topics like temperature, rainfall, or population for detailed regional analysis
- Climate graphs combine temperature and rainfall data to show seasonal patterns for specific locations
- Visual representation through maps makes complex geographical relationships easier to understand and compare