The Demographic Transition Model (Grade 10 NSC Matric Geography): Revision Notes
The Demographic Transition Model
What is the demographic transition model?
The demographic transition model is a population model that shows the main features of population change in more developed countries over time. This model helps geographers understand how birth rates, death rates, and population growth patterns change as societies develop economically and socially.
Demographers (people who study population patterns) noticed that industrialised countries in Western Europe and North America experienced similar changes in their population characteristics over time. Although the exact timing and details varied between countries, there were enough similarities to create a model that describes this process of change, called demographic transition.
Models are useful tools because they clearly show the main features of something, even though they may not capture every detail or variation that exists in the real world. The demographic transition model suggests that all countries will eventually pass through the same stages of population development, given enough time.
The five stages of demographic transition
The original demographic transition model, proposed in 1929, described four main stages of population change. Some demographers now suggest there is a fifth stage, where birth rates fall below death rates, leading to population decline. Japan has already reached this stage.
Let's explore each stage in detail:
Stage 1: High fluctuating stage
During this stage, both birth rates and death rates are very high (around 35 per 1000 people). The population remains small and fluctuates, with no overall growth pattern.
This represents pre-industrial societies where:
- Society is largely agricultural with poor education levels
- There is limited technological development
- Healthcare and sanitation are inadequate
- People have little knowledge about contraception
- Food supplies are irregular, leading to famines
- These conditions result in both high birth rates and high death rates
Stage 2: Early expanding stage
Birth rates remain high (around 35 per 1000), but death rates begin to decrease rapidly to about 20 per 1000. This creates rapid population growth.
This stage occurs because:
- Education, healthcare and sanitation improve dramatically
- Farming techniques advance, improving food storage and transport
- Death rates drop significantly while birth rates stay high
- People still prefer large families for economic and social reasons
Stage 3: Late expanding stage
Birth rates drop sharply to about 20 per 1000, while death rates continue to fall but more slowly to about 15 per 1000. Population continues to grow but at a slower rate.
This happens because:
- Access to healthcare and sanitation continues improving
- Food security increases, further reducing death rates
- People become more urbanised (living in towns and cities)
- Education improves, especially for women
- Access to contraception increases
- Large families are no longer seen as beneficial
- People plan smaller families to provide higher living standards
Stage 4: Low fluctuating stage
Both birth and death rates are low and stable (around 16 per 1000 and 12 per 1000 respectively). The population is large but growth levels off.
This occurs when:
- Changes from stage 3 continue and intensify
- Small families become the norm
- Birth rates often reach replacement level
Stage 5: Declining stage
Some countries now experience birth rates falling below death rates, creating negative population growth.
This happens when:
- The population ages significantly
- Very low birth rates cannot replace the aging population
- Death rates may actually increase due to an elderly population structure
Socio-economic factors influencing demographic transition
The demographic transition is closely linked to changes in socio-economic conditions. Here's how different factors influence each stage:
Stage 1 conditions:
- Agricultural society with poor education
- Limited technology and poor healthcare
- Inadequate sanitation systems
- Limited access to contraception
- Irregular food supplies and frequent famines
Stage 2 improvements:
- Better education, healthcare and sanitation
- Improved farming and food storage techniques
- Better transportation systems
- Death rates fall but people still prefer large families
Stage 3 developments:
- Continued improvements in healthcare and food security
- Increased urbanisation and education
- Better status and education for women
- Greater access to contraception
- Economic benefits of smaller families become apparent
Stage 4 characteristics:
- High levels of education and healthcare
- Urban, industrialised society
- Small families are the social norm
- Birth rates at or near replacement level
Stage 5 features:
- Highly developed, aging societies
- Very low birth rates
- Potential population decline
Regional differences in demographic transition
More developed countries began their demographic transition from stage 1 to stage 2 much earlier than less developed countries. Most developed nations have experienced all four original stages of the model, and some have even entered stage 5.
In contrast, less developed countries have not yet experienced all the socio-economic changes associated with development, so most remain in stages 2 and 3 of the demographic transition.
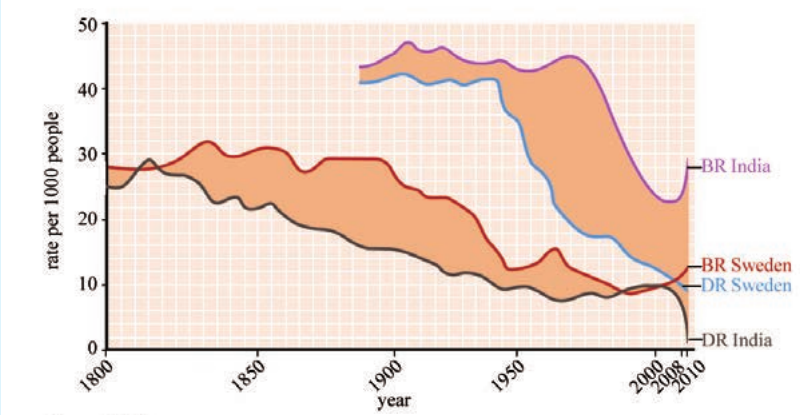
The graph above compares Sweden and India, showing how these two countries moved through demographic transition at different times and rates. Sweden, as a more developed country, began its transition earlier and has progressed further through the stages compared to India.
Case study: The eradication of smallpox
Historical Example: Medical Interventions and Demographic Change
This example shows how medical interventions can dramatically affect death rates and demographic transition:
Timeline of smallpox eradication:
- Mid-18th century: Smallpox killed hundreds of thousands worldwide each year
- 1796: Edward Jenner developed a vaccination against the disease
- Mid-19th century: Compulsory vaccination programmes existed in Europe and North America
- 1914: Most industrialised countries had significantly reduced smallpox cases
- 1967: WHO estimated that two million people still died from smallpox
- 1975: Smallpox persisted only in the Horn of Africa
- 1979: WHO certified complete global eradication
This demonstrates how medical advances can accelerate demographic transition by rapidly reducing death rates.
Population pyramids and demographic transition
Population pyramids provide visual representations of age structure that correspond to different stages of demographic transition. Each stage produces a distinctive pyramid shape:
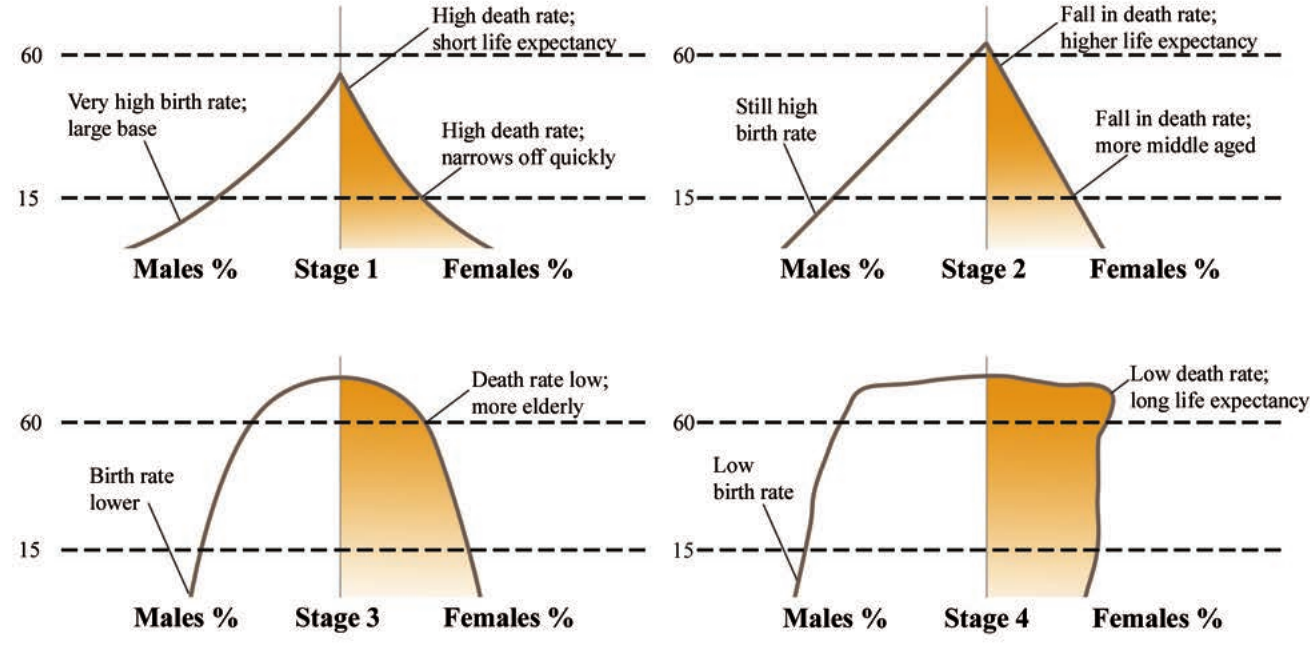
Stage 1: Creates a classic triangular pyramid with a very wide base (many young people) tapering sharply upward due to high death rates and short life expectancy.
Stage 2: Maintains the wide base but becomes more bullet-shaped as death rates fall, creating a larger middle-aged population with increased life expectancy.
Stage 3: Shows a narrower base as birth rates decline, while low death rates create a more barrel or beehive shape with a larger elderly population.
Stage 4: Displays very low birth rates (narrow base) and low death rates with long life expectancy, resulting in an almost rectangular structure representing a stable, aging population.
Understanding these pyramid shapes helps geographers identify which stage of demographic transition a country has reached and predict future population trends.
Key Points to Remember:
- The demographic transition model explains how populations change as societies develop economically and socially
- There are five stages, from high birth/death rates to potential population decline
- Socio-economic improvements like better healthcare, education, and urbanisation drive the transition
- More developed countries completed their transition earlier than developing countries
- Population pyramids provide visual evidence of which stage a country has reached
- The model helps predict future population trends and planning needs