Population Indicators (Grade 10 NSC Matric Geography): Revision Notes
Population Indicators
Population indicators are essential statistics that help us understand how populations change over time. When governments and geographers need to make plans or understand population trends, they rely on these key measurements to show whether populations are growing, declining, or remaining stable.
Understanding population indicators is crucial for urban planning, resource allocation, healthcare provision, and economic development strategies. These statistics form the foundation for demographic analysis and policy-making decisions.
1. Indicators of fertility
Fertility indicators measure a population's ability to reproduce and grow through births. These statistics help us understand reproductive patterns and predict future population changes.
Crude birth rate
The crude birth rate (CBR) measures the number of live babies born in a year for every 1,000 people in a population. It's called "crude" because it considers the entire population without accounting for age or gender differences, even though many people in the population cannot have children.
Calculating the crude birth rate:
The formula is:
Worked Example: Calculating CBR for Germany
Given data:
- Births in Germany (2010): 650,000
- Total population: 81,600,000
Step 1: Apply the formula
Step 2: Calculate
Interpreting crude birth rates:
- High rates: More than 30 per 1,000 are considered high
- Low rates: Less than 18 per 1,000 are considered low
- Global patterns: More developed countries typically have lower birth rates than less developed countries
| Country | Crude Birth Rate (/1000) | Total Fertility Rate |
|---|---|---|
| Japan | 7.44 | 1.20 |
| South Africa | - | 2.38 |
| Nigeria | 36.07 | 4.90 |
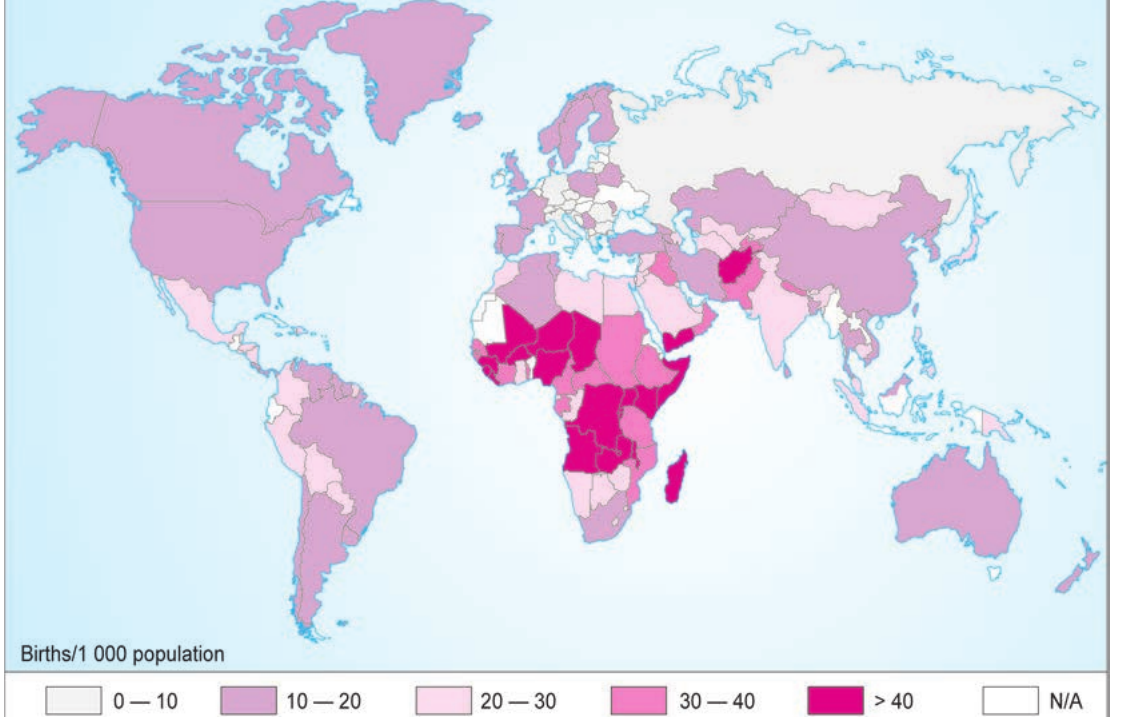
This world map shows clear global patterns in birth rates, with Sub-Saharan Africa showing the highest rates (dark colours) while developed regions like Europe, North America, and East Asia show much lower rates (light colours).
Total fertility rate
The total fertility rate (TFR) represents the average number of children born to each woman during her reproductive years. This indicator provides a clearer picture of fertility patterns than the crude birth rate because it focuses specifically on women of childbearing age.
Global patterns in total fertility rates:
- Less developed countries: Often more than 6 children per woman (like Nigeria with 4.90)
- More developed countries: Usually less than 2 children per woman (like Japan with 1.20)
- Middle-income countries: Typically between 2-4 children per woman (like South Africa with 2.38)
Replacement rate
The replacement rate occurs when the total fertility rate reaches approximately 2.1 children per woman. This means that each woman and her partner are just replacing themselves in the population, so the population will remain stable rather than growing or declining.
The replacement rate is slightly above 2.0 (approximately 2.1) because some children unfortunately don't survive to reproductive age. This small buffer ensures population stability despite child mortality rates.
2. Indicators of mortality
Mortality indicators measure death patterns in populations and provide crucial information about health conditions, living standards, and development levels in different countries.
Crude death rate
The crude death rate (CDR) measures the number of deaths per 1,000 people in a population during one year. Like the crude birth rate, it doesn't consider age or gender differences across the population.
Calculating the crude death rate:
The formula is:
Worked Example: Calculating CDR for Germany
Given data:
- Deaths in Germany (2010): 840,000
- Total population: 81,600,000
Step 1: Apply the formula
Step 2: Calculate
Interpreting crude death rates:
- Low rates: Below 10 per 1,000 are considered low
- High rates: Above 20 per 1,000 are considered high
- Global patterns: Generally, crude death rates are higher in less developed countries, though this can vary due to age structure differences
| Country | Crude Death Rate (/1000) | Infant Mortality Rate | Life Expectancy |
|---|---|---|---|
| Japan | 7.44 | 1.2 | 82.17 |
| South Africa | - | 2.38 | 54 |
| Nigeria | 36 | 4.9 | 47 |
Infant mortality rate
The infant mortality rate (IMR) measures the number of deaths of babies less than one year old per 1,000 live births in a given year. Unlike crude rates, this indicator does consider age - specifically focusing on the most vulnerable age group.
The infant mortality rate serves as an excellent indicator of healthcare quality, living conditions, and overall development levels in different countries. It's considered one of the most sensitive measures of a nation's health and development status.
Global patterns:
- Developed countries: Very low rates (like Japan with 1.2 per 1,000)
- Developing countries: Much higher rates, reflecting healthcare and living condition challenges
Life expectancy
Life expectancy represents the average number of years a person is likely to live based on current mortality patterns. This indicator closely relates to death rates and provides insight into overall health conditions and quality of life in different countries.
The most commonly used measure is life expectancy at birth, which estimates how long a newborn baby is likely to live. Life expectancy is strongly influenced by factors such as healthcare quality, nutrition, living conditions, and overall development levels.
3. Natural population increase
The natural population increase (NI) tells us the rate at which a population grows or declines based solely on natural factors - births and deaths. This indicator excludes migration, focusing only on the balance between people being born and people dying.
Understanding natural increase as a rate
It's crucial to understand that natural increase measures the rate of change, not the actual number of people added. This distinction matters because the same rate can produce very different absolute numbers depending on population size.
For example:
| Place | Population Size | Natural Increase (%) | Number of People Added |
|---|---|---|---|
| A | 10,000 | 10 | 1,000 |
| B | 100,000 | 1 | 1,000 |
Both places add exactly 1,000 people, but Place A has a much higher growth rate because its population is smaller.
Calculating natural population increase
Natural increase is expressed as a percentage. The formula is:
Worked Example: Calculating Natural Increase
Given data:
- Crude birth rate (CBR) = 26/1,000
- Crude death rate (CDR) = 14/1,000
Step 1: Find the difference CBR - CDR = 26 - 14 = 12/1,000
Step 2: Apply the formula
This means the population is growing at a rate of 1.2% per year.
Global patterns and implications
Natural increase varies dramatically worldwide:
| Country | Crude Birth Rate (/1000) | Crude Death Rate (/1000) | Natural Increase (/100) |
|---|---|---|---|
| Japan | 7.44 | 9.83 | - |
| South Africa | 21.33 | 13.90 | - |
| Nigeria | 36.07 | 16.31 | - |
When examining global patterns:
- High natural increase: Occurs where birth rates significantly exceed death rates, typically in less developed countries
- Low or negative natural increase: Occurs where birth and death rates are similar or where death rates exceed birth rates, often in highly developed countries
- The relationship between development and natural increase: More developed countries generally show lower rates of natural increase
Doubling time
An important related concept is doubling time - the number of years it would take for a population to double in size at its current growth rate. Countries with high natural increase rates have shorter doubling times, while those with low rates take much longer to double their populations.
Key Points to Remember:
-
Population indicators help us understand how populations change through births, deaths, and natural increase - essential tools for planning and development
-
Crude birth rate and crude death rate both use the same formula structure: , making them easy to calculate and compare
-
The replacement rate of 2.1 represents the fertility level needed to maintain stable population size - remember it as 2 parents plus a small buffer for child mortality
-
Natural population increase shows the balance between births and deaths, but remember it's a rate of change, not absolute numbers - the same rate produces different actual numbers in different-sized populations
-
Global development patterns generally show that more developed countries have lower birth rates, death rates, and natural increase rates compared to less developed countries