Population Structure (Grade 10 NSC Matric Geography): Revision Notes
Population Structure
Introduction
Population structure refers to how people within a country or region are organised by different characteristics, particularly age and gender. Understanding population structure helps governments and planners make important decisions about services, infrastructure, and economic planning. The structure of a population tells us about a country's development level and future challenges.
Population structure analysis is essential for urban planning, resource allocation, and predicting future societal needs. Countries with different population structures face entirely different challenges and opportunities.
Age structure
Age structure describes how people are distributed across different age groups within a population. This distribution reflects important factors like birth rates, death rates, and life expectancy patterns in that area.
Every population contains people of different ages, but the proportions vary significantly between countries. When birth rates are high, many people will belong to the younger age groups. Conversely, when life expectancy is high and birth rates are low, there will be larger proportions of older people.
Planners need detailed information about age structure because people at different life stages have varying needs:
- Young populations (high proportion under 15) require more daycare services, primary schools, and family support services
- Working-age populations (aged 16-64) need employment opportunities, housing, and transport infrastructure
- Ageing populations (high proportion over 65) require more healthcare services, care centres, and homes for the elderly
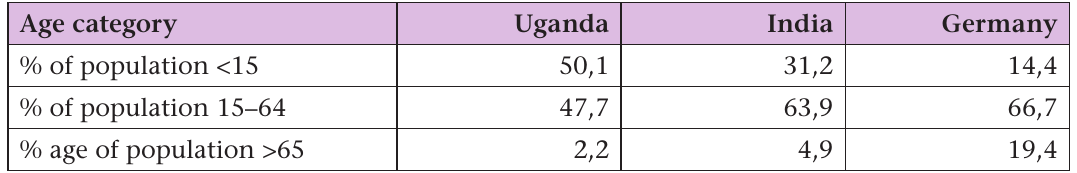
The table above shows how dramatically age structure can vary between countries. Uganda represents a typical developing country with a very young population - over 50% are under 15 years old. Germany shows the opposite pattern, typical of developed countries, with nearly 20% over 65 years old. India falls somewhere between these extremes, showing a transitional population structure.
The dependency ratio
The dependency ratio is a crucial measurement that shows the economic burden on a country's working population. It calculates how many people depend on others for financial support compared to those who are economically active.
People can be divided into three economic categories based on age:
- Children (0-15 years): Usually economically dependent as they attend school
- Working age adults (16-64 years): Typically economically active and supporting others
- Elderly (65+ years): Generally economically dependent due to retirement
Calculating the dependency ratio
The dependency ratio uses this important formula:
The global average dependency ratio is 52%. This means for every 100 working people worldwide, there are 52 people who need financial support. In more developed countries, this ratio typically ranges between 50-70%, while in less developed countries it often exceeds 100%. When the dependency ratio surpasses 100%, each working person must support more than one dependent person, creating significant economic pressure.
Sex structure
Sex structure examines the number of males and females within different age groups of a population. The sex ratio specifically measures the number of males for each female in the population.
The world average sex ratio is 1.06 males per female, meaning there are slightly more men than women globally. However, this ratio varies considerably between countries and age groups for several reasons:
- War casualties: Military conflicts typically affect more males, reducing sex ratios in affected age groups
- Cultural preferences: Some societies favour boys over girls, leading to practices like female abortion or infanticide
- Life expectancy differences: Women generally live longer than men, so older age groups often have more females
- Migration patterns: Economic migration often involves more males moving for work opportunities
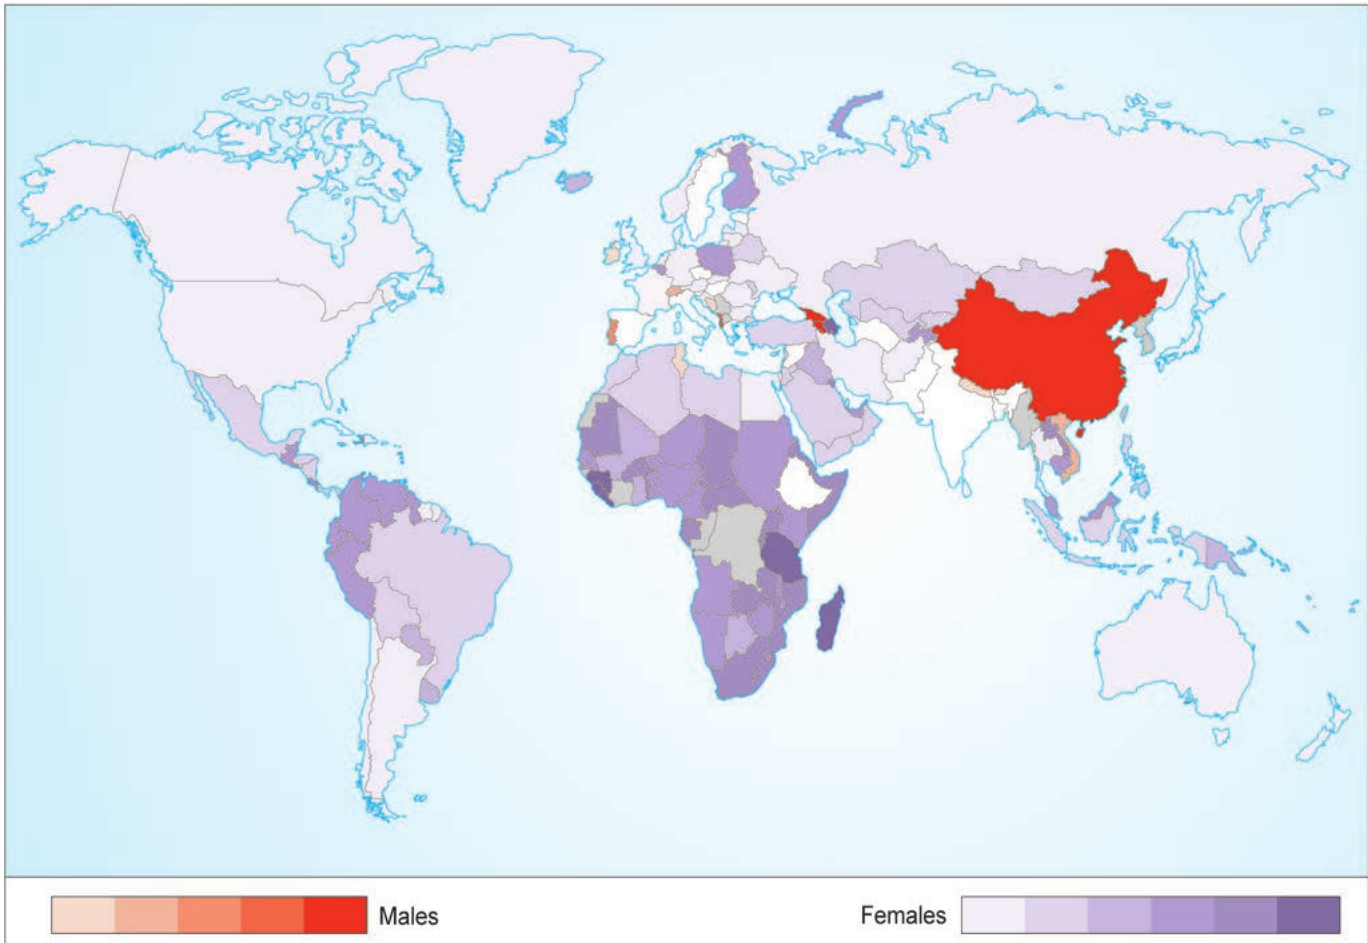
The world map shows significant variations in sex ratios globally. China appears in bright red, indicating a substantial male majority due to the former one-child policy and cultural preferences for sons. Many African countries display purple shades, suggesting female majorities, while most developed countries show balanced ratios in neutral colours.
Case study: Japan's ageing population
Case Study: Japan's Demographic Challenge
Japan provides an excellent example of the challenges facing countries with rapidly ageing populations. The country's demographic structure creates both immediate problems and long-term concerns.
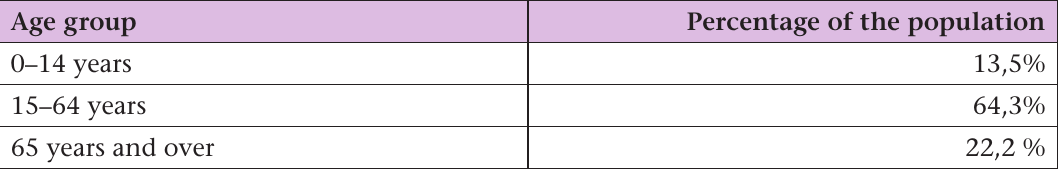
Japan's age structure shows the characteristics of a highly developed nation with low birth and death rates. Only 13.5% of the population is under 14 years old, while 22.2% are over 65 years old. This creates a dependency ratio where fewer working-age people must support growing numbers of elderly citizens.

The elderly warning sign commonly seen in Japanese villages illustrates how the ageing population affects daily life, requiring special considerations for pedestrian safety and community planning.
Challenges of Japan's ageing population
Japan faces several serious problems due to its demographic structure:
- Economic burden: Fewer working people must support increasing numbers of pensioners
- Healthcare strain: Growing demand for medical services and elderly care facilities
- Labour force decline: Insufficient young workers to replace retiring employees
- Pension crisis: Rising costs of supporting retirees with shrinking tax base
Government responses
The Japanese government has implemented various strategies to address these demographic challenges:
- Financial incentives: Providing monthly allowances and subsidising school fees to encourage families to have more children
- Workplace flexibility: Allowing people to work beyond traditional retirement age and encouraging women to return to work after childbearing
- Healthcare investment: Increasing the number of doctors and improving services for the elderly
- Immigration considerations: Exploring ways to attract younger workers from other countries
Japan's experience demonstrates how understanding population structure helps governments anticipate future challenges and develop appropriate policy responses.
Summary
Key Points to Remember:
- Age structure shows how populations are distributed across age groups and varies dramatically between developing and developed countries
- The dependency ratio measures economic burden - it's calculated by dividing dependents (0-15 and 65+) by working-age population (16-64) and multiplying by 100
- Sex structure examines male-female ratios, with global average of 1.06 males per female, though this varies due to cultural, economic, and biological factors
- Countries with young populations need more schools and family services, while those with ageing populations require more healthcare and elderly care facilities
- Japan's case study shows how demographic challenges require comprehensive government responses including financial incentives, workplace changes, and service improvements