Biological Drawings, Diagrams, and Tables (Grade 10 NSC Matric Life Sciences): Revision Notes
Biological Drawings, Diagrams, and Tables
Introduction to scientific communication
Drawings and diagrams play a crucial role in scientific communication, particularly in Life Sciences. It's important to understand that these are not artistic creations or casual sketches. Instead, they serve as precise, clear representations of what you observe during scientific investigations. The primary purpose is to create accurate visual records that can be used to interpret and communicate your findings to others.
Remember: Biological drawings are scientific communication tools, not artwork! They must be clear representations of what you observe that can be used to interpret what you saw.
When you create biological drawings and diagrams, you are essentially translating your observations into a universal scientific language that other researchers can understand and use for further study.
Essential rules for biological drawings and diagrams
Creating effective biological drawings requires following specific guidelines to ensure clarity and scientific accuracy. These rules help maintain consistency and make your work easily interpretable by others in the scientific community.
Technical requirements
Critical Drawing Standards
Your drawings must meet these essential technical requirements:
- Use a sharp pencil to create clear, smooth lines that are easy to see and reproduce
- Draw large enough so that all structures are clearly visible - aim for at least 10 lines of paper in size
- Position in the centre of the page to ensure balanced presentation
- Keep it two-dimensional - avoid shading or three-dimensional effects that can obscure important details
- Include a heading or caption that clearly identifies what the drawing represents
Source and scale information
Every biological drawing should include important contextual information:
- Specify the section type using standard abbreviations: transverse section (T/S), cross section (C/S), or longitudinal section (L/S)
- State the source of your drawing, such as "from a biological specimen," "from a micrograph," or "from a slide"
- Indicate magnification or scale either in the caption or in a corner of the drawing
Labelling guidelines
Essential Labelling Rules
Proper labelling is crucial for scientific drawings. Label lines must follow these specific rules:
- Draw label lines parallel to the top of the page using a ruler for accuracy
- Ensure lines do not cross each other or have arrows at the end
- Each line should clearly indicate the structure being named
- Align labels neatly, preferably on one side of the page unless there are many labels requiring both sides
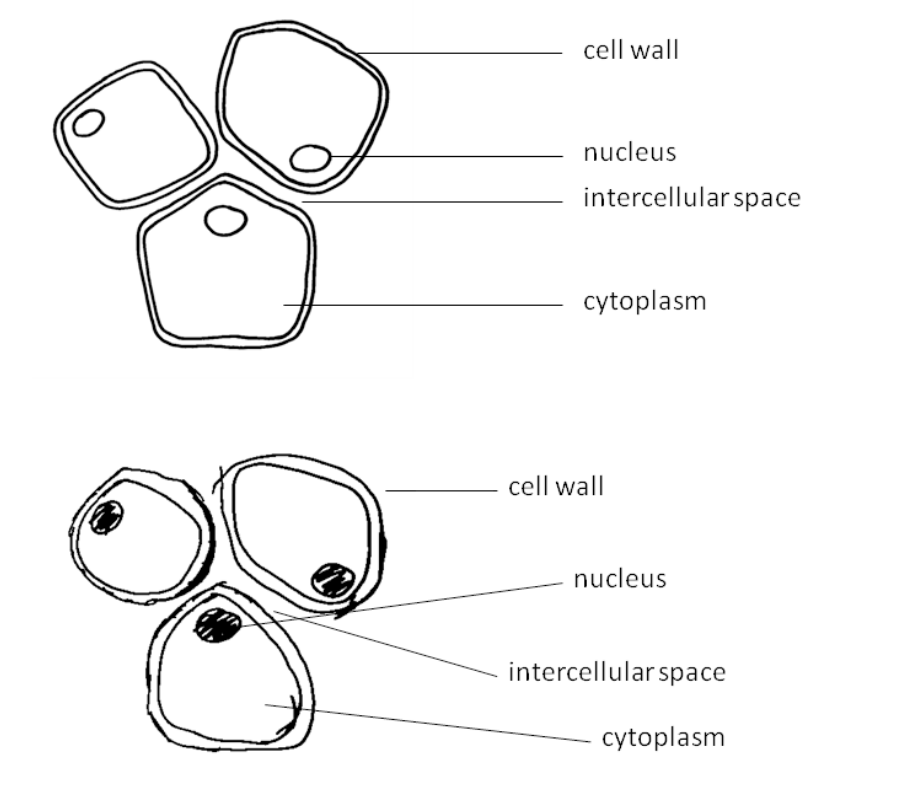
The figure above demonstrates the difference between effective and ineffective biological drawings. The top drawing shows proper technique with clean lines and clear labelling, while the bottom drawing illustrates common mistakes to avoid.
Identifying quality in biological drawings
When assessing the quality of biological drawings, you should look for several key features that distinguish good scientific illustrations from poor ones. Understanding these differences will help you create better drawings and evaluate the work of others.
Good biological drawings demonstrate scientific accuracy, clear communication, and adherence to established conventions. They should be precise representations that allow viewers to understand the biological structures being illustrated without confusion or ambiguity.
Two-dimensional and three-dimensional representations
In Life Sciences, you have the option to create drawings in either two or three dimensions, depending on your specific needs and the nature of what you're illustrating.
Choosing the Right Dimension
Three-dimensional drawings are useful when you need to show the depth and spatial relationships of biological objects. These drawings help viewers understand how structures relate to each other in space and can provide a more complete picture of complex biological systems.
Two-dimensional drawings are more commonly used for apparatus diagrams and simplified representations. They make complex shapes easier to understand by presenting them as if you were looking at a cross-section through the apparatus or organism.
This approach reduces visual complexity while maintaining essential structural information.
Understanding tables in Life Sciences
Tables are fundamental tools for organising and presenting scientific data in a clear, concise manner. They serve as structured ways to display information that would be difficult to understand if presented as continuous text.
What is a Table?
A table is a summary of data, using as few words as possible. It is a grid divided up into rows and columns that helps organise information systematically.

What makes a good table
A well-constructed table follows specific organisational principles:
- Tables summarise data using as few words as possible while maintaining clarity
- Grid structure divides information into rows and columns for easy navigation
- Headings are placed above the table to introduce the data being presented
- Variable identification should include both dependent and independent variables being investigated
- Independent variables are typically placed in the first column
- Unit specifications must be included in column headings (such as grammes, hours, km/hr, or cm)
When to use tables effectively
Tables serve multiple purposes in scientific work and are particularly useful in the following situations:
- Summarising information from multiple sources or observations
- Comparing related aspects or characteristics across different conditions
- Recording experimental results in an organised, systematic way
- Illustrating patterns and trends that might not be obvious in paragraph form
- Preparing data that will later be used to construct graphs or charts
Tables are especially valuable when you need to present numerical data, make comparisons between different conditions, or track changes over time. They provide a clear structure that makes it easy for readers to find specific information and identify relationships between different variables.
Key Points to Remember:
- Biological drawings are scientific communication tools, not artistic expressions - focus on accuracy over appearance
- Always follow the essential rules: sharp pencil, large size, centre positioning, two-dimensional representation, and proper labelling
- Label lines must be parallel, non-crossing, and clearly indicate the structures being named
- Choose between 2D and 3D representations based on what information you need to communicate
- Tables should summarise data efficiently with clear headings, proper units, and logical organisation of variables