Inverse Proportion Patterns, Relationships, and Graphs (Grade 10 NSC Matric Mathematical Literacy): Revision Notes
Inverse Proportion Patterns, Relationships, and Graphs
What is an inverse proportion relationship?
An inverse proportion is a special type of relationship between two quantities. When two variables are inversely proportional, as one quantity gets larger, the other gets smaller. Similarly, as one quantity gets smaller, the other gets larger.
The key feature is that the two quantities move in opposite directions - they have an inverse relationship with each other.
This opposite movement pattern is what distinguishes inverse proportion from other mathematical relationships. Think of it like a seesaw - when one side goes up, the other must go down!
Key characteristics of inverse proportion
In an inverse proportion relationship, there are several important patterns to recognize:
- When one variable increases, the other decreases
- When one variable decreases, the other increases
- The product of the two variables stays constant
- The relationship forms a curved graph called a hyperbola
Critical Insight: The constant product is the defining mathematical feature of inverse proportion. If (where is constant), then and are inversely proportional.
Worked example: Rectangle with constant area
Let's explore inverse proportion using a practical application that demonstrates how this relationship works in real situations.
Worked Example: Rectangle with Fixed Area
Problem: A rectangle has a fixed area of 32 square units. The length and breadth can change, but the area must always stay the same.
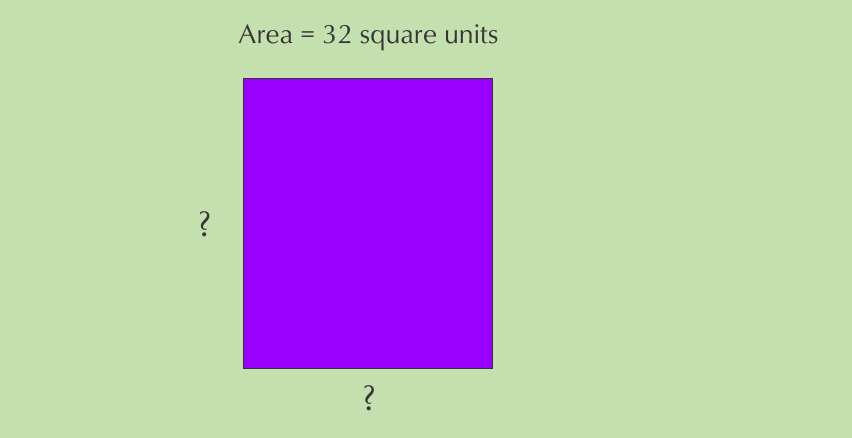
Solution: Since Area = length × breadth = 32, we can express this as:
Analysis:
- If the length gets smaller, the breadth must get bigger
- If the length gets bigger, the breadth must get smaller
- This happens because the area stays constant at 32 square units
Mathematical relationship:
Creating a table of values
For our rectangle with area = 32, we can calculate different combinations of length and breadth to see the inverse proportion pattern clearly:
| Length (l) | 1 | 2 | 4 | 8 | 16 | 32 |
|---|---|---|---|---|---|---|
| Breadth (b) | 32 | 16 | 8 | 4 | 2 | 1 |
Notice the clear inverse proportion pattern:
- When length = 1, breadth = 32 ()
- When length = 2, breadth = 16 ()
- When length = 4, breadth = 8 ()
- The product is always 32!
This constant product confirms that length and breadth are inversely proportional in this scenario.
Graphing inverse proportion relationships
When we plot these values on a coordinate graph, we get a smooth curved line that reveals the visual pattern of inverse proportion:
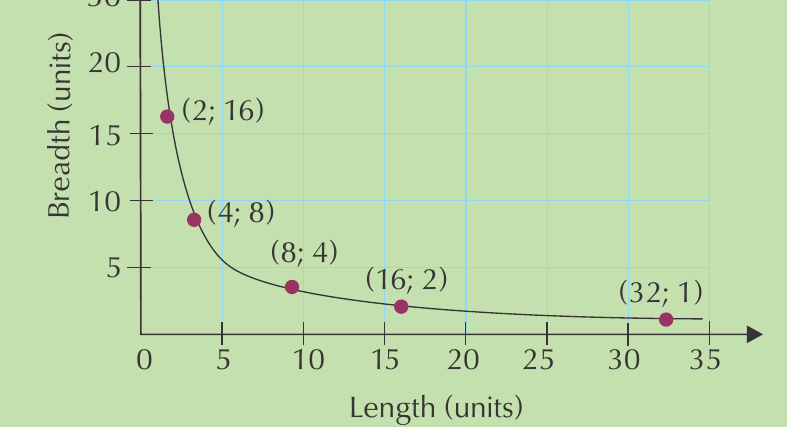
The graph shows our calculated points: (1; 32), (2; 16), (4; 8), (8; 4), (16; 2), (32; 1)
Each point represents a valid rectangle with area 32, and together they form the characteristic curve of an inverse proportion relationship.
Properties of inverse proportion graphs
Understanding the mathematical properties of these graphs helps us recognize and work with inverse proportion relationships:
Shape: The graph forms a smooth hyperbola (curved line)
Why a hyperbola? The mathematical equation (where is constant) always produces a hyperbolic curve. This is a fundamental property of inverse proportion relationships.
Continuity: The graph is continuous because:
- Measurement values can be any positive number
- There are infinite possible values between any two points
- We can have lengths like 1.5, 2.7, 3.14, etc.
Axes behavior: The curve never touches the x-axis or y-axis because:
- Length can never be zero (you can't have a rectangle with no length)
- Breadth can never be zero (you can't have a rectangle with no width)
- Both variables must always be positive values
Key Mathematical Insight: In inverse proportion graphs, the axes act as asymptotes - lines that the curve approaches but never actually reaches. This reflects the real-world constraint that neither variable can equal zero.
Exam tips
Essential Exam Strategies:
- Recognise the pattern: Look for products that stay constant across different value pairs
- Check your calculations: Multiply each pair - the result should be exactly the same
- Graph carefully: Plot points accurately and draw a smooth curve, not straight line segments
- Remember the shape: Inverse proportion graphs are always curved, never straight lines
- Identify the constant: Find the value of in the equation
Key Points to Remember:
- Inverse proportion means opposite movement - one goes up, the other goes down
- The product stays constant - in our example
- Graphs form smooth curves that never touch the axes
- Real measurements are continuous so the graph has no gaps between points
- Both variables must be positive in most real-world situations
- The mathematical relationship can be expressed as where is constant