Linear Patterns, Relationships, and Graphs (Grade 10 NSC Matric Mathematical Literacy): Revision Notes
Linear Patterns, Relationships, and Graphs
Introduction
When examining how two quantities relate to each other, patterns often emerge that can be displayed clearly on graphs. Understanding these patterns helps us make sense of real-world situations and predict future outcomes. This section explores how to plot points accurately on a grid and recognise when relationships form linear patterns.
Plotting points on a grid
Understanding ordered pairs
Ordered pair: Two numbers written in a specific sequence that pinpoint the exact location of a point on a grid. This is also called a coordinate pair.
The format for an ordered pair is , where:
- The first number represents the horizontal coordinate (x-axis position)
- The second number represents the vertical coordinate (y-axis position)
Method for plotting points
When you need to plot a point using an ordered pair like , follow these steps:
- Start at the origin - Begin at point where the two axes meet
- Move horizontally - Count along the x-axis to reach your first number
- Move vertically - From that position, count up or down to reach your second number
- Mark the point - Place a dot where the grid lines intersect
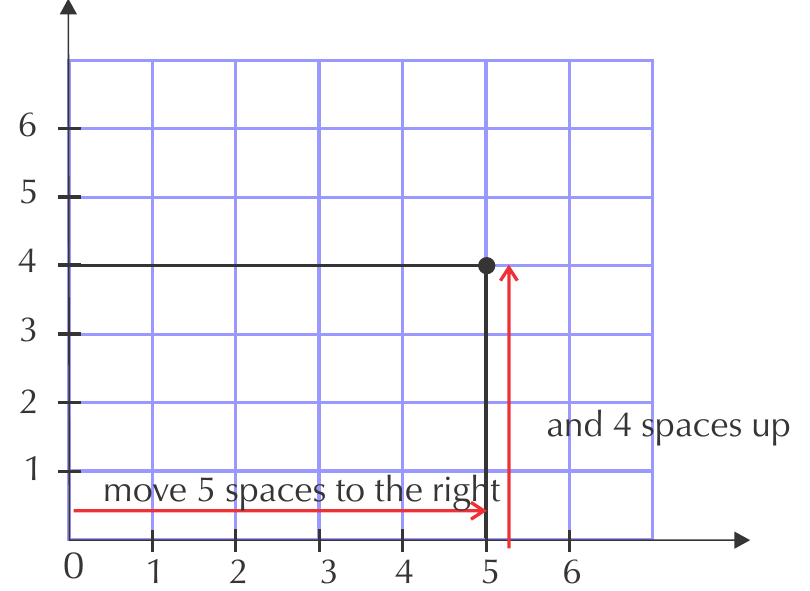
This diagram shows exactly how to reach point by moving 5 spaces right and then 4 spaces up.
Worked Example: Museum visitor data
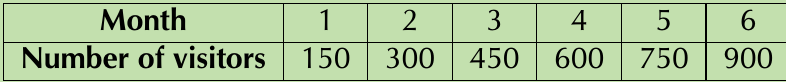
Question: A new museum tracks its visitor numbers over 6 months. The data shows a steady increase of 150 visitors each month.
Solution:
Step 1: Convert the data into ordered pairs
From the table: , , , , ,
Step 2: Plot each point on the grid
- Start at origin
- For each point, move right to the month number, then up to the visitor count
- Mark each position with a dot
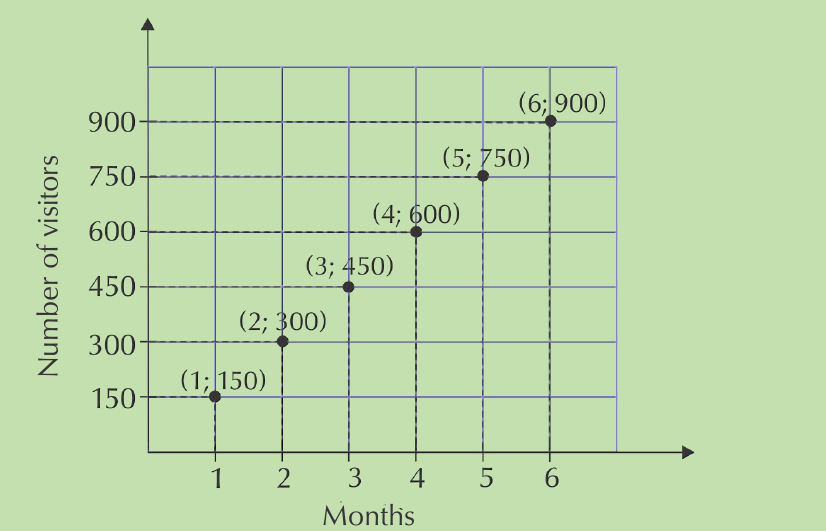
Step 3: Analyse the pattern
The points should not be connected with a solid line because the data is discrete - you cannot have fractional months like 2.5 months.
Step 4: Identify variables
- Independent variable: Month (appears first, controls the relationship)
- Dependent variable: Number of visitors (depends on which month it is)
Linear relationships and graphs
Recognising linear relationships
Linear relationship: A connection between two quantities that creates a straight line when the data points are plotted on a graph.
Key characteristics of linear relationships:
- Points form a straight line pattern
- There is a constant rate of change between the variables
- One variable increases or decreases steadily as the other changes
Real-world linear relationship example
Consider the cost of purchasing potatoes by weight:
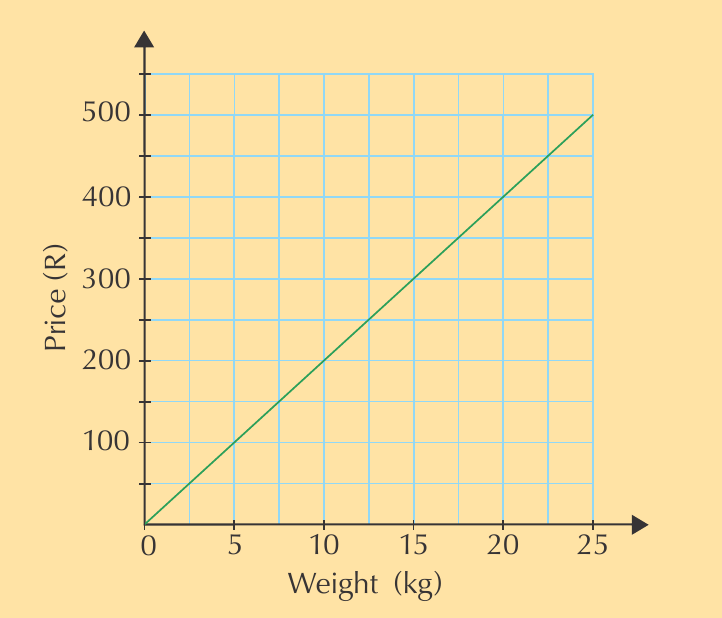
This graph demonstrates a perfect linear relationship because:
- The price increases at a constant rate as weight increases
- All points would fall on a straight line
- There is a direct proportional relationship between weight and cost
Independent vs dependent variables
Understanding which variable depends on which is crucial for creating accurate graphs:
- Independent variable: The input value that you control or that changes naturally (plotted on x-axis)
- Dependent variable: The output value that responds to changes in the independent variable (plotted on y-axis)
Examples:
- Time (independent) → Temperature (dependent)
- Study hours (independent) → Test score (dependent)
- Weight of potatoes (independent) → Total cost (dependent)
Exam tips for linear relationships
Critical Points for Success:
- Always check if points form a straight line to confirm linearity
- Label your axes clearly with appropriate units
- Identify which variable is independent (usually time, distance, or quantity)
- When connecting points, consider whether the data is continuous (can be connected) or discrete (separate points only)
- Use a ruler to draw straight lines accurately in exams
Key Points to Remember:
- Ordered pairs are written as and give exact positions on a grid
- Plot points by starting at origin, moving right along x-axis, then up/down along y-axis
- Linear relationships form straight lines and show constant rates of change
- Independent variables come first and control the relationship, while dependent variables respond to changes
- Real-world applications of linear graphs include costs, growth rates, and time-based changes