Interpretation of Graphs (Grade 10 NSC Matric Mathematics): Revision Notes
Interpretation of Graphs
Graph interpretation is a crucial skill that involves reading visual information from function graphs to determine equations, find key points, and understand the behaviour of different mathematical functions. This skill allows you to extract meaningful information from visual representations of mathematical relationships.
Mastering graph interpretation is essential for success in mathematics as it bridges the gap between abstract equations and visual understanding. This skill appears frequently in examinations and real-world applications.
Understanding function types from graphs
Different types of functions have distinctive shapes that help you identify them quickly. Recognising these patterns is the first step in successful graph interpretation.
Parabolas have a curved, U-shaped or inverted U-shaped appearance. When the parabola opens downward (like an upside-down U), the coefficient of x² is negative. When it opens upward, the coefficient is positive.
Hyperbolas consist of two separate curved branches. These functions have the form and appear in opposite quadrants. The branches never touch each other and approach but never reach invisible boundary lines called asymptotes.
Trigonometric functions create wave-like patterns that repeat at regular intervals. These smooth, oscillating curves can be shifted up or down and have varying amplitudes.
Each function type has unique visual characteristics that serve as your first clue in identification. Take time to examine the overall shape before focusing on specific points or calculations.
Determining equations from graphs
Finding parabola equations
When working with parabolas of the form , you need to find the values of a and q using information from the graph.
The process involves these key steps:
- Examine the sketch carefully - Look at the shape to determine if a is positive or negative
- Find q using the y-intercept - The y-intercept occurs where x = 0
- Use another given point to solve for a
- Write the final equation
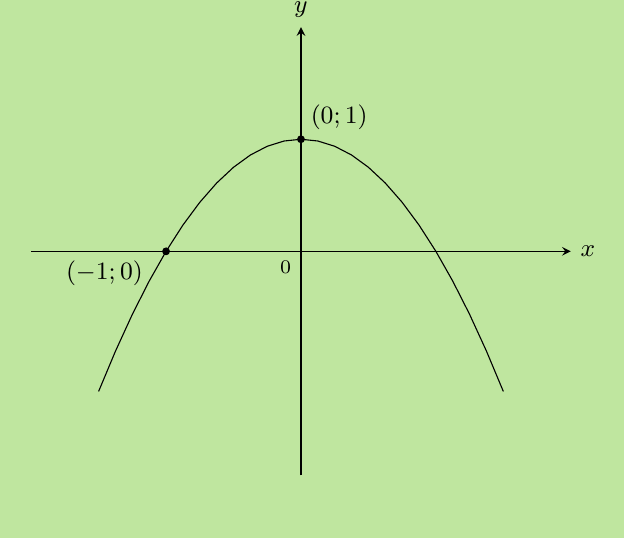
Worked Example: Finding a Parabola Equation
For a parabola with y-intercept (0, 1) and x-intercept (-1, 0):
Step 1: The parabola opens downward, so a < 0, and it's shifted upward, so q > 0.
Step 2: Using the y-intercept (0, 1):
Step 3: Using point (-1, 0):
Step 4: The equation is .
Finding hyperbola equations
For hyperbolas of the form , follow a similar systematic approach:
- Examine the sketch - Identify which quadrants contain the branches
- Substitute given points into the equation
- Solve the equations simultaneously
- Write the final equation
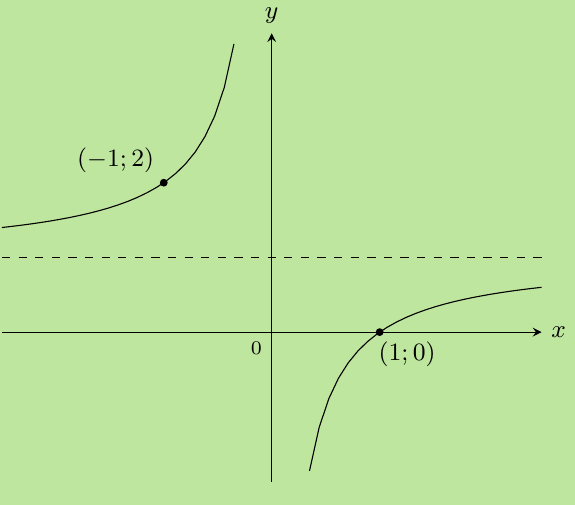
Worked Example: Finding a Hyperbola Equation
For a hyperbola passing through (-1, 2) and (1, 0):
Step 1: The branches lie in the second and fourth quadrants, indicating a < 0, and the graph is shifted upward, so q > 0.
Step 2: Using point (-1, 2):
Using point (1, 0):
- , so
Step 3: Substituting into the first equation:
- Therefore,
Step 4: The equation is .
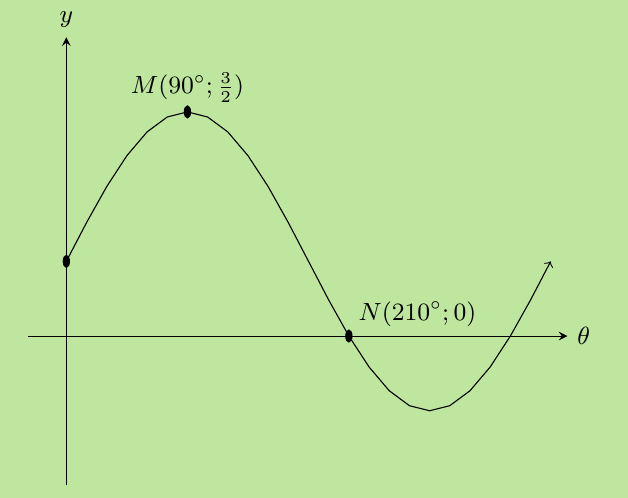
Finding trigonometric function equations
For trigonometric functions of the form , use the maximum and minimum points or x-intercepts:
- Identify the function type from the wave pattern
- Use key points to find the parameters
- Solve simultaneously for a and q
- Write the final equation
Trigonometric functions require careful attention to their periodic nature and amplitude. The maximum and minimum values are particularly useful for determining the parameters a and q.
Interpreting multiple graphs
When dealing with multiple functions on the same coordinate system, you can find intersection points, intercepts, and calculate distances between specific points.
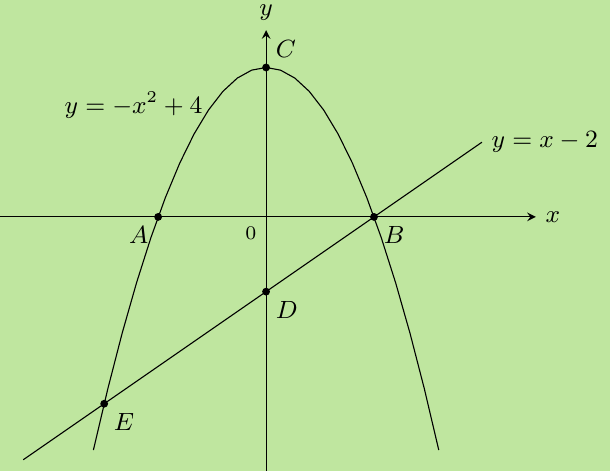
Finding intersection points
To find where two graphs intersect, set their equations equal to each other and solve:
For and :
- or
When : , giving point
Calculating intercepts
Y-intercepts: Set x = 0 in the equation
- For : , giving point (0, 4)
X-intercepts: Set y = 0 in the equation
- For : , so , giving
Distance calculations
When points lie on the same vertical line, add their distances from a reference point: If is at and is at , then units.
Key Points to Remember:
- The shape of the graph tells you about the sign of key coefficients
- Always use the y-intercept to find the constant term q quickly
- Substitute given points systematically to solve for unknown parameters
- Check your final equation by verifying it works for all given points
- Distance calculations between points on vertical lines involve simple addition or subtraction
Exam tips for graph interpretation
Essential Exam Strategies:
- Always start by examining the sketch before doing any calculations
- Identify the function type from its shape and behaviour
- Use given points systematically - substitute them into the general form
- Check your answers by substituting back into the original points
- Pay attention to signs - negative coefficients affect the direction of opening
- Look for symmetry in parabolas and patterns in trigonometric functions
Common mistakes to avoid
Critical Pitfalls to Watch For:
- Confusing the signs when the parabola opens downward (a < 0)
- Forgetting to check which quadrants hyperbola branches occupy
- Mixing up x-intercepts and y-intercepts in calculations
- Not simplifying equations to their final form
- Rushing through the sketch examination phase