Quadratic Functions (Grade 10 NSC Matric Mathematics): Revision Notes
Quadratic Functions
Introduction to quadratic functions
A quadratic function is any function that can be written in the form , where and are constants. These functions create graphs called parabolas, which have a distinctive U-shaped or inverted U-shaped curve.
The distinctive curved shape of parabolas makes quadratic functions easily recognisable on a graph. This U-shape appears in many real-world contexts, from the path of projectiles to the design of satellite dishes.
The simplest quadratic function is . This is our starting point for understanding how quadratic functions behave.
Functions of the form y = x²
When working with , we can create a table of values to understand the function's behaviour:
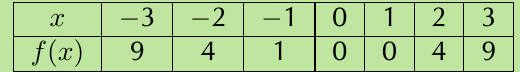
From this table, we can see that the function produces the same output values for positive and negative inputs of the same magnitude. For example, .
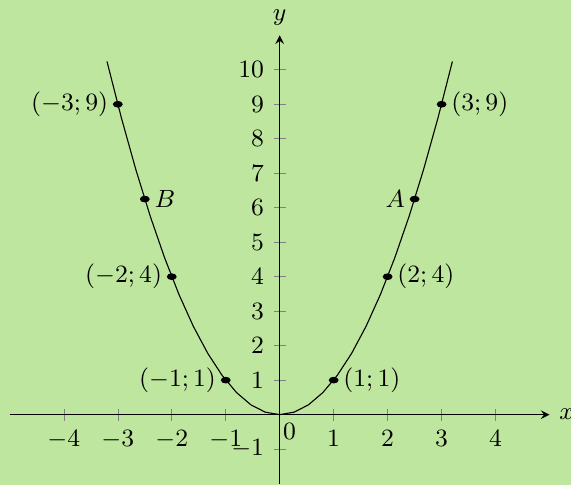
When we plot these points and connect them with a smooth curve, we get our first parabola:
Key characteristics of y = x²
The basic quadratic function has several important properties that form the foundation for understanding all quadratic functions:
Key Properties of y = x²:
- Domain: All real numbers, written as
- Range: All non-negative real numbers, written as
- Turning point: - this is the minimum point
- Axis of symmetry: The y-axis (line )
- Shape: Upward-opening parabola (forms a "smile")
Functions of the form y = ax² + q
The general form of a quadratic function is , where:
- Parameter a affects the shape and direction of the parabola
- Parameter q affects the vertical position of the parabola
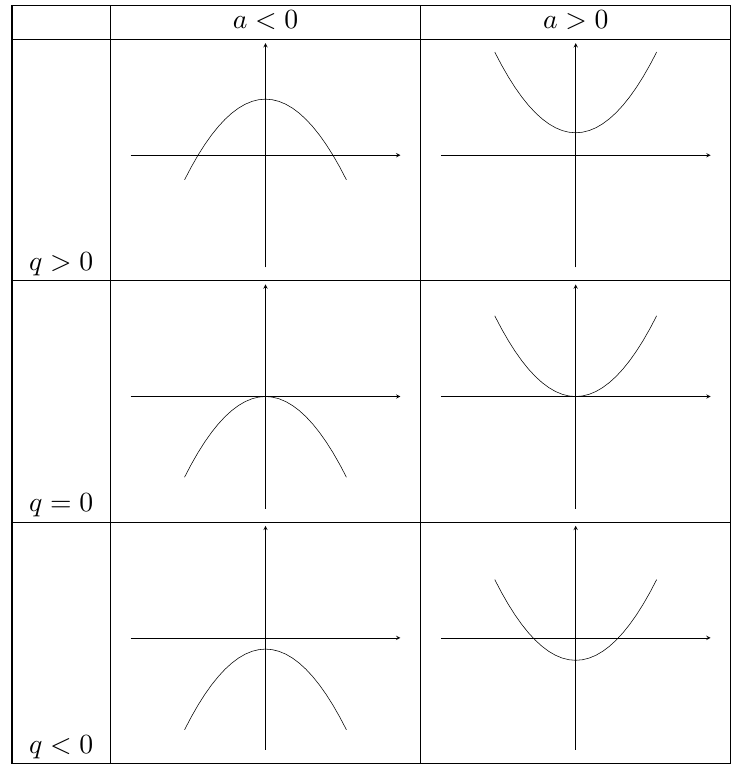
The effect of parameter q
The value of creates a vertical shift of the basic parabola .
Understanding Vertical Shifts:
- When : The graph shifts upward by units
- When : The graph shifts downward by units
- When : No vertical shift occurs
This means that all points on the parabola move the same distance in the same direction vertically.
The effect of parameter a
The value of determines both the direction and width of the parabola:
Understanding Parameter a:
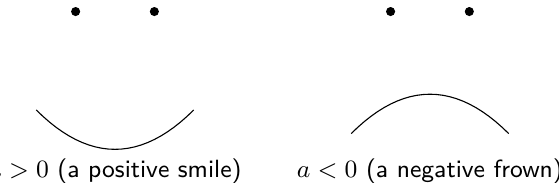
Direction:
- When a > 0: The parabola opens upward (forms a "smile") and has a minimum turning point
- When a < 0: The parabola opens downward (forms a "frown") and has a maximum turning point
Width: The size of affects the width:
- Larger values of make the parabola narrower
- Smaller values of make the parabola wider
Key characteristics of quadratic functions
Domain and range
Domain: For all quadratic functions of the form , the domain is because there are no restrictions on the x-values.
Range: The range depends on the values of and :
Determining the Range:
- If : The range is (the parabola opens upward with minimum value )
- If : The range is (the parabola opens downward with maximum value )
Intercepts
Understanding where a quadratic function intersects the axes is crucial for graphing and analysis.
Y-intercept: To find where the graph crosses the y-axis, substitute into the equation:
So the y-intercept is always at the point (0, q).
X-intercepts: To find where the graph crosses the x-axis, substitute and solve for :
For real x-intercepts to exist, , which means and must have opposite signs. If and have the same sign, there are no real x-intercepts.
Turning points
The turning point (also called the vertex) of any quadratic function is at .
- If : This is a minimum point
- If : This is a maximum point
Axis of symmetry
For quadratic functions of the form , the axis of symmetry is always the y-axis, or the line .
Sketching quadratic graphs
To sketch the graph of a quadratic function , follow these systematic steps:
- Identify the sign of a (determines if parabola opens up or down)
- Find the y-intercept (substitute )
- Find the x-intercepts (substitute and solve)
- Identify the turning point (always at )
- Plot the points and sketch the curve
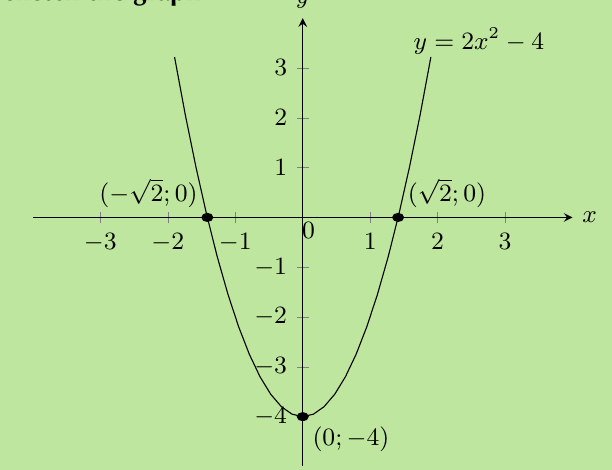
Worked Example 1: Sketching y = 2x² - 4
Step 1: Examine the equation
- , so the parabola opens upward (minimum turning point)
Step 2: Find the intercepts
-
Y-intercept: When , . Point:
-
X-intercepts: When ,
Points: and
Step 3: Identify the turning point From the standard form, the turning point is .
Step 4: Sketch the graph
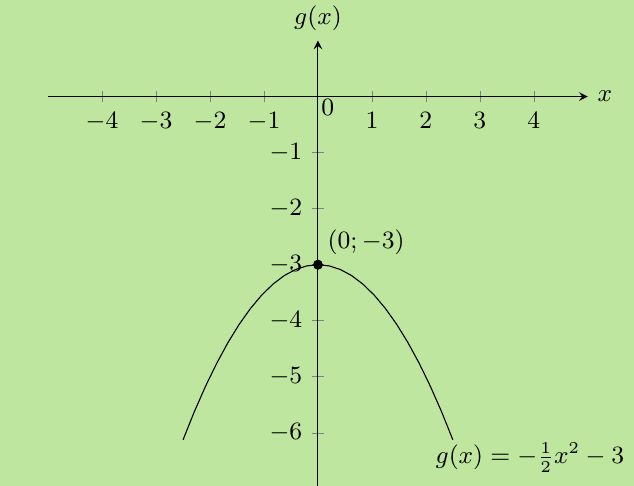
Worked Example 2: Sketching g(x) = -½x² - 3
Step 1: Examine the equation
- , so the parabola opens downward (maximum turning point)
Step 2: Find the intercepts
-
Y-intercept: When , . Point:
-
X-intercepts: When ,
Since cannot be negative, there are no real x-intercepts.
Step 3: Identify the turning point The turning point is .
Step 4: Sketch the graph
Exam tips
Essential Exam Strategies:
- Always check the sign of a first to determine if the parabola opens up or down
- Remember that the turning point for is always at
- When finding x-intercepts, be careful with negative values under the square root - these indicate no real intercepts
- The axis of symmetry for these functions is always
- Use the symmetry property: if is on the graph, then is also on the graph
Key Points to Remember:
- Quadratic functions have the form and create parabolic graphs
- Parameter a determines the direction (positive = upward, negative = downward) and width of the parabola
- Parameter q shifts the entire graph vertically by units
- The turning point is always at and represents either a minimum (when ) or maximum (when )
- All quadratic functions of this form have domain and are symmetric about the y-axis