Summary (Grade 10 NSC Matric Mathematics): Revision Notes
Summary
Functions are mathematical relationships that connect input values (x) to output values (y) according to specific rules. Understanding functions is essential for solving many mathematical problems and interpreting real-world relationships.
Key characteristics of functions
Independent and dependent variables form the foundation of any function. The independent variable (usually x) represents the input value that you can choose freely. The dependent variable (usually y) represents the output value that depends entirely on what you choose for the independent variable.
Think of it like a machine - you put in an x-value and get out a corresponding y-value. This analogy helps visualise how functions transform inputs into outputs through a specific rule or process.
Domain and range define the boundaries of a function. The domain includes all possible x-values that you can use as inputs for a particular function. For each x-value in the domain, there should be at most one corresponding y-value. The range contains all possible y-values that the function can produce when you use at least one x-value from the domain.
Remember the key relationship: The domain contains all valid x-values; the range contains all possible y-values the function can produce. This one-to-one or many-to-one relationship is what makes something a function.
Asymptotes are imaginary straight lines that a function's graph approaches but never actually touches or crosses. These lines help us understand the behaviour of functions, especially when dealing with values that approach infinity or create undefined situations.
Types of functions and their forms
Mathematics recognises several important categories of functions, each with distinctive characteristics and applications:
Linear functions follow the form , where 'a' represents the gradient (slope) and 'q' represents the y-intercept. These functions create straight-line graphs and show constant rates of change.
Parabolic functions use the form , where the squared term creates the characteristic U-shaped or inverted U-shaped curves called parabolas. The value of 'a' determines whether the parabola opens upward or downward.
Hyperbolic functions take the form , creating curved graphs with asymptotes. These functions are undefined when x equals zero, which creates interesting behaviour patterns.
Exponential functions follow , where the variable appears as an exponent. These functions show rapid growth or decay and are crucial for modelling population changes, radioactive decay, and compound interest.
Trigonometric functions include three main forms: , , and . These functions repeat in predictable patterns and are essential for describing periodic phenomena like waves and oscillations.
Worked Example: Function Type Identification
To identify which type of function represents:
Step 1: Look at the general form
The equation has the pattern
Step 2: Identify the coefficients
Here, and
Step 3: Match to function type
This matches the linear function form, so it's a linear function with gradient 3 and y-intercept 5.
Function table examples
Function tables help visualise the relationship between input and output values. Here are some examples:
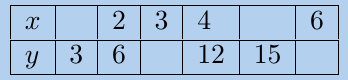
This table shows a pattern where y-values increase consistently, suggesting a linear relationship.
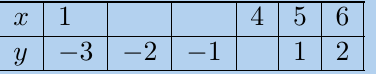
This table demonstrates how functions can produce both positive and negative outputs depending on the input values.
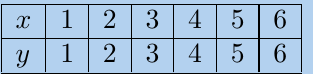
This simple table represents the function , where every input equals its corresponding output.
When working with function tables, look for patterns in how the y-values change as x-values increase. This can help you identify the type of function and predict missing values.
Working with function problems
When identifying functions, remember that each x-value must correspond to exactly one y-value.
Worked Example: Finding Y-Intercept
To find the y-intercept of an exponential function like :
Step 1: Substitute x = 0 (y-intercept occurs when x = 0)
Step 2: Calculate the result
Therefore, the y-intercept is 2.
When determining which function passes through a specific point like (1, 7), substitute the coordinates into each option and check which equation holds true.
Key Points to Remember:
- The independent variable (x) is the input you control; the dependent variable (y) is the output that responds to your input
- Domain contains all valid x-values; range contains all possible y-values the function can produce
- Asymptotes are lines the function approaches but never touches, helping predict function behaviour
- Each function type has a standard form:
- Linear:
- Parabolic:
- Hyperbolic:
- Exponential:
- Trigonometric: (and similar for cos and tan)
- Function tables provide concrete examples of input-output relationships and help identify function types