Venn Diagrams (Grade 10 NSC Matric Mathematics): Revision Notes
Venn Diagrams
What is a Venn diagram?
A Venn diagram is a graphical way of showing the relationships between different sets. Think of it as a visual map that helps you understand how groups of things relate to each other.
Key Components of a Venn Diagram:
- Each set is represented by a closed curve (usually a circle)
- The sample space is represented by a rectangle labelled S
- The region inside a curve shows the elements that belong to that set
- The region outside a curve shows the elements that are excluded from that set
Venn diagrams are particularly useful in probability because they help us visualise different events and their relationships clearly.
Types of set relationships
There are three main ways that two sets A and B can relate to each other:
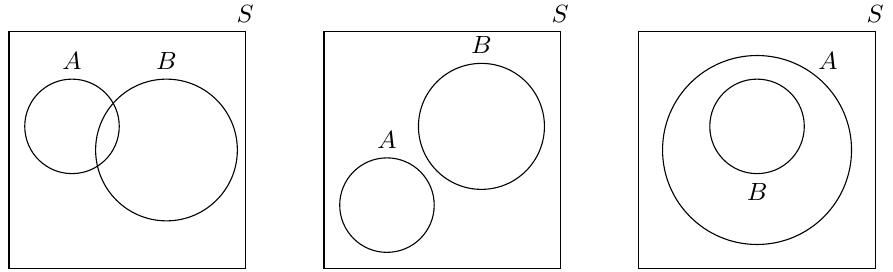
- Overlapping sets: The sets have some elements in common, shown by the overlapping region
- Disjoint sets: The sets have no elements in common - they don't overlap at all
- Subset relationship: One set is completely contained within another set
Understanding these relationships is essential for solving probability problems involving multiple events. The visual representation makes it much easier to identify which outcomes belong to which events.
Reading a Venn diagram
When you look at a Venn diagram, you need to understand what each region represents:
Understanding Venn Diagram Regions:
- A only: Elements that belong to set A but not to set B
- B only: Elements that belong to set B but not to set A
- A ∩ B (intersection): Elements that belong to both set A and set B
- Outside both circles: Elements that belong to the sample space S but not to A or B (this is called the complement)
The sample space S always contains all possible outcomes of your experiment.
Key notation and symbols
Essential Mathematical Notation:
- S: Sample space (universal set)
- n(S): Number of elements in the sample space
- A ∩ B: Intersection - elements in both A and B
- A ∪ B: Union - elements in A or B or both
- (A ∪ B)': Complement of the union - elements not in A or B
Drawing Venn diagrams step by step
Step-by-Step Process for Drawing Venn Diagrams:
- Identify the sample space and write down all possible outcomes
- Calculate n(S) - the total number of outcomes
- Identify the events you need to show
- Draw a rectangle for the sample space S
- Draw circles for each event, making sure they overlap appropriately
- Place elements in the correct regions
Worked example: Dice probability
Worked Example: Dice Probability
Question: Represent the sample space of two rolled dice and show these events:
- Event A: the sum of the dice equals 8
- Event B: at least one of the dice shows a 2
Solution:
The sample space consists of all possible combinations when rolling two dice. We can show this visually with all 36 possible outcomes.
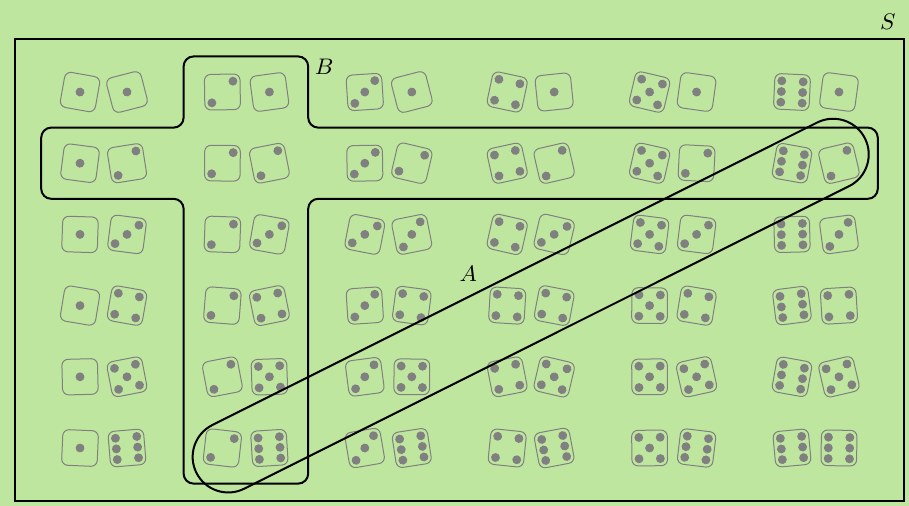
In this diagram:
- Event A (sum equals 8) is shown by one curved boundary
- Event B (at least one die shows 2) is shown by another curved boundary
- The regions help us identify which outcomes belong to each event
Worked example: Playing cards
Worked Example: Playing Cards
Question: Consider diamonds removed from a deck of cards. A random card is selected.
- P: An even diamond is chosen
- R: A royal diamond is chosen (J, Q, K)
Solution:
Step 1: Write the sample space S = {A; 2; 3; 4; 5; 6; 7; 8; 9; 10; J; Q; K}
Step 2: Find n(S) n(S) = 13
Step 3: Draw the Venn diagram
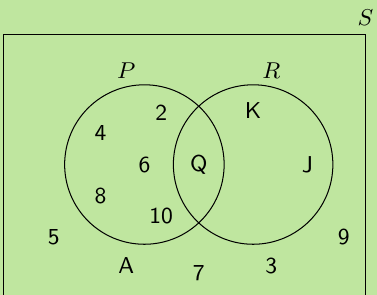
In this diagram:
- Circle P contains the even diamonds: {2, 4, 6, 8, 10}
- Circle R contains the royal diamonds: {J, Q, K}
- The intersection P ∩ R is empty (no card is both even and royal)
- Other elements are placed outside both circles
Interpreting completed Venn diagrams
When given a completed Venn diagram, you can identify various set relationships and counts:
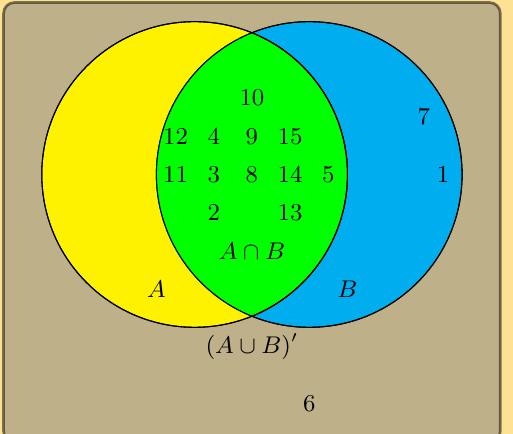
Looking at this diagram:
- Set A includes all numbers in the yellow circle
- Set B includes all numbers in the blue circle
- A ∩ B (intersection) contains the numbers in the green overlap region
- (A ∪ B)' (complement) contains elements outside both circles
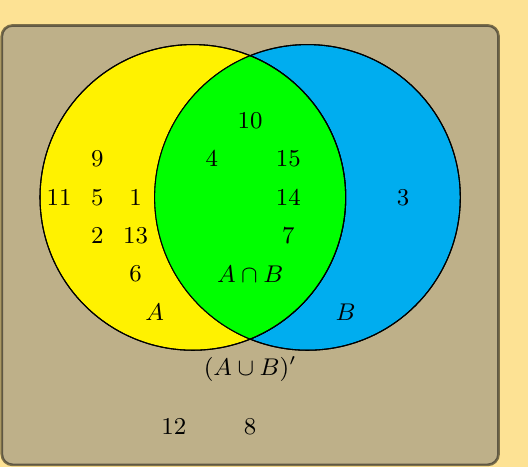
This diagram shows how elements are distributed across different regions, making it easy to count elements in unions, intersections, and complements.
Common exam traps
Avoid These Common Mistakes:
- Forgetting the sample space: Always draw the rectangle S first
- Miscounting elements: Double-check that elements appear in only one region
- Confusing "and" with "or": "And" means intersection (∩), "or" means union (∪)
- Ignoring the complement: Elements outside all circles still belong to S
Exam tips
Key Strategies for Success:
- Always start by identifying the sample space clearly
- Count elements carefully in each region
- Check that all elements are accounted for
- Use the diagram to answer questions about intersections, unions, and complements
- Remember that the total of all regions should equal n(S)
Remember!
Key Points to Remember:
- Venn diagrams are visual tools that show relationships between sets using circles and rectangles
- The sample space S (rectangle) contains all possible outcomes of an experiment
- Overlapping circles show events that share common elements (intersection)
- Separate circles represent events with no common elements (disjoint)
- Always count systematically through each region to find probabilities
- Use Venn diagrams to visualise complex probability problems and make them easier to solve