Five-Number Summary (Grade 10 NSC Matric Mathematics): Revision Notes
Five-Number Summary
What is a five-number summary?
A five-number summary provides a quick and effective way to describe the key features of any data set. It works hand-in-hand with box-and-whisker plots to give you both numerical and visual representations of the same statistical information.
The five-number summary captures the most important characteristics of your data by identifying five crucial values that divide your data set into quarters. This makes it incredibly useful for comparing different data sets and understanding the spread and central tendency of your data.
The five-number summary is one of the most efficient ways to summarise large amounts of data into just five key values, making it perfect for quick comparisons and analysis.
Components of the five-number summary
The five-number summary includes exactly five values, listed from smallest to largest:
- Minimum value - the smallest number in your data set
- First quartile (Q₁) - the value that separates the bottom 25% from the top 75%
- Median (Q₂) - the middle value that divides the data in half
- Third quartile (Q₃) - the value that separates the bottom 75% from the top 25%
- Maximum value - the largest number in your data set
These five numbers tell you where your data begins and ends, where the centre lies, and how the data spreads across different sections.
Understanding percentiles
Another way to think about the five-number summary is through percentiles:
- 0th percentile = Minimum value
- 25th percentile = First quartile (Q₁)
- 50th percentile = Median (Q₂)
- 75th percentile = Third quartile (Q₃)
- 100th percentile = Maximum value
Percentiles show you what percentage of data falls below each value. For example, 25% of your data falls below Q₁, and 75% falls below Q₃.
Box-and-whisker plots
The box-and-whisker plot displays your five-number summary visually. Understanding its structure helps you read statistical information quickly.
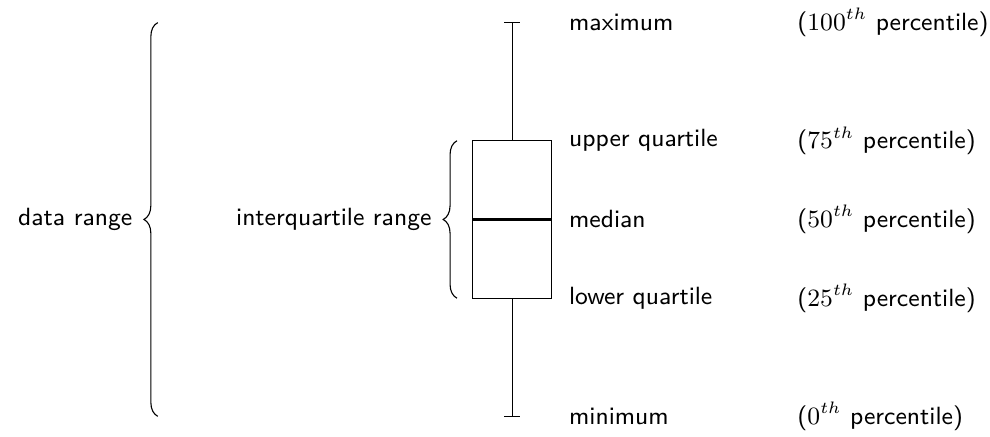
In a box plot:
- The box shows the interquartile range (distance between Q₁ and Q₃)
- The line inside the box marks the median
- The whiskers (lines extending from the box) show where the minimum and maximum values are located
- The entire plot shows the data range from minimum to maximum
Box plots can be drawn vertically or horizontally - both show exactly the same information. The orientation doesn't change the data representation.
How to calculate the five-number summary
Follow these systematic steps to find your five-number summary:
Step 1: Arrange your data
Sort all values from smallest to largest. This makes finding the quartiles much easier.
Step 2: Find the minimum and maximum
The minimum is your first value, and the maximum is your last value.
Step 3: Calculate the median
For the median (middle value):
- If you have an odd number of values, take the middle one
- If you have an even number of values, add the two middle values and divide by 2
Step 4: Find the quartiles
Use the percentile method to locate Q₁ and Q₃:
- Q₁ lies at the 25% position in your ordered data
- Q₃ lies at the 75% position in your ordered data
- When the position falls between two values, calculate the average of those values
Worked example
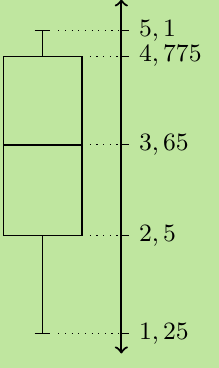
Worked Example: Creating a Box-and-Whisker Plot
Question: Draw a box-and-whisker plot for this data set: {1.25; 1.5; 2.5; 2.5; 3.1; 3.2; 4.1; 4.25; 4.75; 4.8; 4.95; 5.1}
Solution:
Step 1: Find minimum and maximum The data is already arranged in order.
- Minimum = 1.25 (first value)
- Maximum = 5.1 (last value)
Step 2: Calculate the median
- With 12 values, the median lies between the 6th and 7th values:
- Median = (3.2 + 4.1) ÷ 2 = 3.65
Step 3: Find the first quartile (Q₁)
- Q₁ lies between the 3rd and 4th values:
- Q₁ = (2.5 + 2.5) ÷ 2 = 2.5
Step 4: Find the third quartile (Q₃)
- Q₃ lies between the 9th and 10th values:
- Q₃ = (4.75 + 4.8) ÷ 2 = 4.775
Five-number summary:
Minimum: 1.25, Q₁: 2.5, Median: 3.65, Q₃: 4.775, Maximum: 5.1
Reading box plots
You can work backwards from box plots to identify the five-number summary. This skill is essential for interpreting statistical displays quickly.
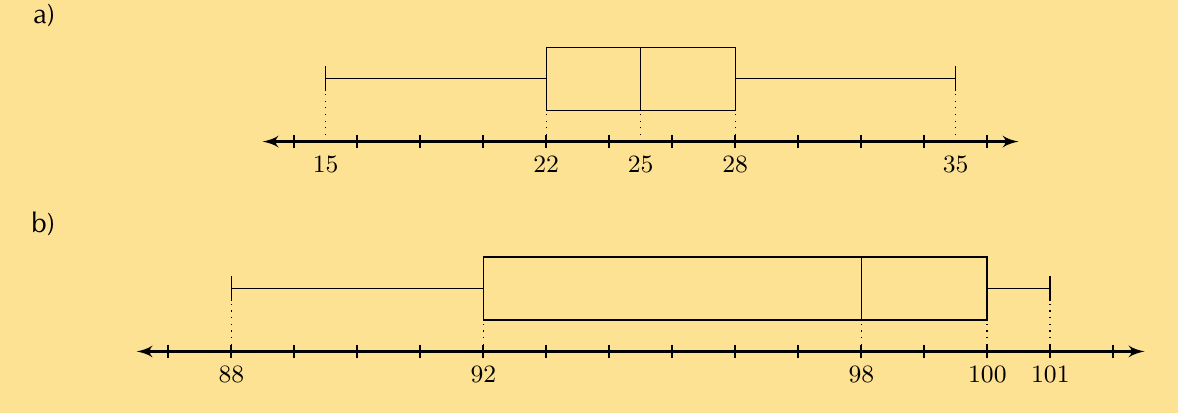
For plot a):
- Minimum ≈ 15, Q₁ ≈ 22, Median ≈ 25, Q₃ ≈ 28, Maximum ≈ 35
For plot b):
- Minimum ≈ 88, Q₁ ≈ 92, Median ≈ 98, Q₃ ≈ 100, Maximum ≈ 101
Common Exam Tips:
- Always arrange your data in ascending order before starting calculations
- When finding quartiles, be careful with positions - use the percentile method consistently
- Check that your five numbers are in ascending order: Min ≤ Q₁ ≤ Median ≤ Q₃ ≤ Max
- Box plots and five-number summaries contain identical information presented differently
- Practice reading values from box plot scales accurately
Key Points to Remember:
- Five-number summary includes minimum, Q₁, median, Q₃, and maximum values
- These correspond to the 0th, 25th, 50th, 75th, and 100th percentiles
- Box plots provide a visual representation of the same five numbers
- Always sort your data first before calculating quartiles and median
- The box shows the interquartile range, while whiskers show the full data range