Information Management (Grade 11 NSC Matric Computer Application Technology): Revision Notes
Processing Data
What is processing data?
When you have raw data, it's often not in a format that's immediately useful. Processing data means working with and organising this raw information to extract meaningful insights that help you make decisions or answer questions.
Think of data processing like sorting through a messy drawer to find exactly what you need - you're not changing what's in the drawer, just organising it better!
The main goal of data processing is to transform your raw data into information that is relevant and appropriate for your specific needs. This might involve rearranging the data, calculating totals or averages, or filtering out information you don't need.
Tools and techniques for processing data
There are several methods you can use to process your data effectively. The most common technique is sorting, which means arranging or moving data without actually changing the values themselves.
Important preparation steps
Critical Steps Before Processing Your Data:
Before you start processing your data, you need to:
- Understand the features of the software you're using (like Excel) and how to use them properly
- Make sure your data is in the correct format for what you want to achieve - if it's not, you may need to reformat it or export it to a more suitable format
- Remember that you might need to use more than one tool to process your data correctly
- Ensure your data includes proper column headings for the best results
Sorting data in Excel
Sorting is one of the most useful data processing techniques. It helps you arrange data alphabetically, numerically, or by date, making it much easier to analyse and understand patterns.
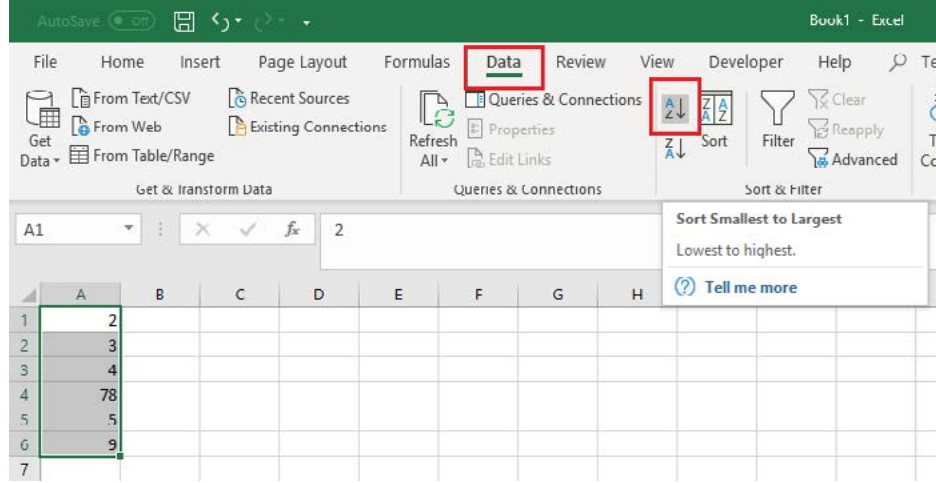
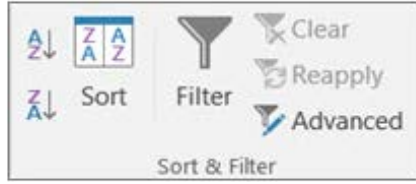
You can access Excel's sorting tools through the Data tab in the ribbon, where you'll find the Sort & Philtre group.
Here's what you can sort:
- Text: From A to Z (ascending) or Z to A (descending)
- Numbers: From smallest to largest or largest to smallest
- Dates: From oldest to newest or newest to oldest
- Custom formats: Based on your own criteria like colours or icons
Step-by-step sorting procedures
Worked Example: Sorting Text Data
- Select a cell in the column you want to sort
- Go to the Data tab and look for the Sort & Philtre group
- For quick sorting: Click either the A-Z button (ascending order) or Z-A button (descending order)
- For more control: Click the "Sort" button to open the Sort dialogue box
Worked Example: Sorting Numerical Data
- Follow the same steps as for text sorting
- For ascending order (low to high): Click the ascending sort button
- For descending order (high to low): Click the descending sort button
Sorting multiple columns or complex data
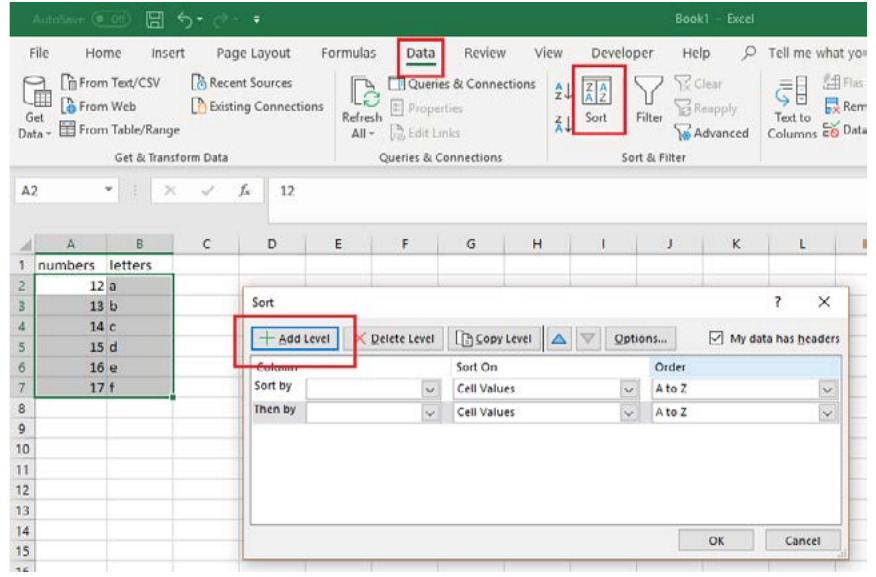
When you need to sort by more than one criterion, use the Sort dialogue box:
Worked Example: Multi-Level Sorting
- Select any cell in your data range (Excel will automatically detect the range)
- Click Sort in the Data tab
- In the Sort dialogue box: Choose your first column to sort by
- Under "Sort On": Select whether to sort by values, cell colour, font colour, or cell icon
- Under "Order": Choose ascending (A to Z, smallest to largest) or descending (Z to A, largest to smallest)
- To add more sorting levels: Click "Add Level" and repeat the process
- Click OK to apply your sorting
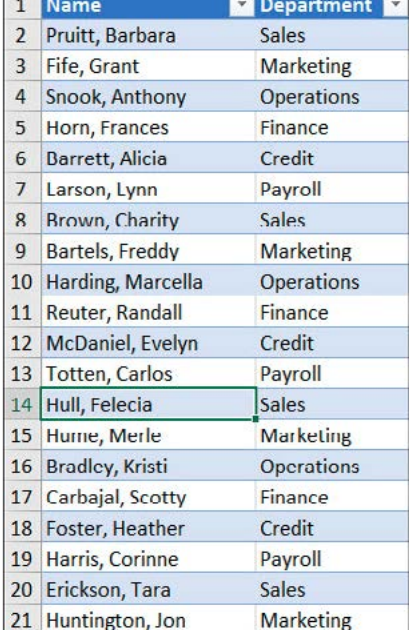
This employee directory shows how data looks before and after sorting - notice how the information becomes much more organised and easier to read.
Using formulae and functions in Excel
Excel provides powerful functions that help you analyse your processed data. These functions allow you to perform calculations on large datasets quickly and accurately.
Essential Excel Functions for Data Processing:
- SUM: Calculates the total of a range of numbers
- AVERAGE: Finds the average (mean) value of a range of numbers
- MIN: Returns the smallest value in a list
- MAX: Returns the largest value in a list
- COUNT: Counts how many cells contain numbers
- COUNTIF: Counts cells that meet specific criteria
Remember: All Excel formulas must begin with an equals sign (=).
These functions are excellent for interpreting large datasets, but they're not ideal for creating visual representations. For that, you'd use charts and graphs to help visualise data and identify trends.
Extracting appropriate information
Sometimes you need to pull specific information from large datasets. Excel and databases offer different tools for this:
In spreadsheets (Excel)
- VLOOKUP function: Perfect for finding specific information in large datasets
- Filtering tools: Help you display only the data that meets certain criteria
In databases (like Access)
- Queries: Allow you to extract exactly the information you need using specific search criteria
The advantage of using databases is that you can often accomplish with a single query what might require multiple steps in a spreadsheet.
Real-world case study
Let's look at how Mrs Dlamini, a school administrative assistant, uses data processing to analyse student performance.
Worked Example: Analysing Student Performance Data
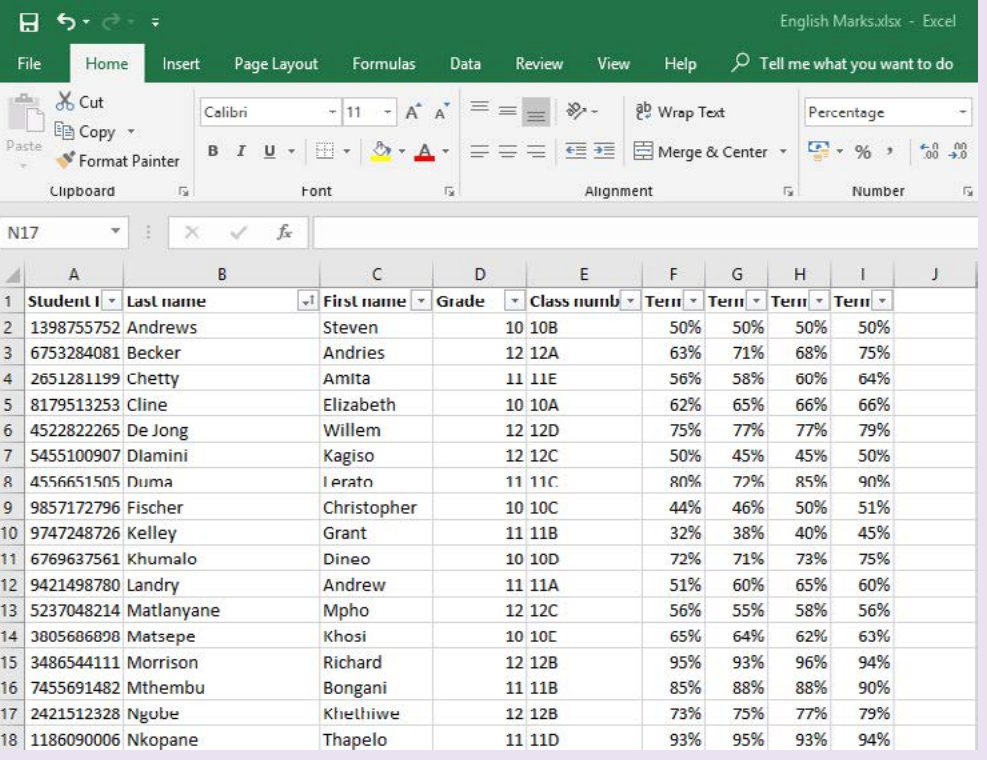
The situation: The head of English department asked Mrs Dlamini to find the yearly average English mark for all Grade 11 students from the previous year.
Mrs Dlamini's approach:
-
First, she examined the spreadsheet structure and found it contained:
- Student ID numbers
- Full names
- Grade levels
- Class numbers
- Term marks for multiple terms
-
The challenge: The spreadsheet was sorted alphabetically by surname, making it difficult to identify which students were in Grade 11.
-
Her solution:
- Used Excel's philtre feature on the Grade column to display only Grade 11 students
- Applied the AVERAGE function to calculate each student's yearly average
- Used the AVERAGE function again to find the overall Grade 11 class average
Key insight: If this same data had been stored in a database instead of a spreadsheet, Mrs Dlamini could have accomplished the same task with just one query, demonstrating how different tools can be more or less efficient depending on your needs.
Remember!
Key Points to Remember:
- Data processing transforms raw data into useful information - it's like organising a messy room to find what you need quickly
- Sorting is your best friend - use Excel's Data tab and Sort & Philtre tools to organise data alphabetically, numerically, or by date
- Always prepare your data first - ensure proper formatting and column headings before you start processing
- Excel functions save time - use SUM, AVERAGE, MIN, MAX, COUNT, and COUNTIF to analyse large datasets efficiently
- Choose the right tool - spreadsheets are great for calculations and sorting, while databases excel at extracting specific information through queries